At Geosense, we use earth observation data to help companies with their exploration efforts, through geological remote sensing projects. As such, we often come across geologists who use satellite data, but don’t closely follow the advances that happen in the remote sensing world. Many are aware of some of the more commonly used datasets, but not of newer, less well-known options. Therefore, they fail to see possibilities that open up when these newer datasets are used. An important attribute of any remotely sensed dataset is the spatial resolution, but from conversations with clients it is clear that many people misunderstand how much of a difference this aspect makes. This article will try to the importance of spatial resolution, by looking at a number of Digital Elevation Models (DEMs).
Spatial resolution visualized
The resolution of remote sensing data is generally indicated by a single number. Let us, for example, take a look at the resolution of the SRTM DEM, which is probably the most commonly used DEM out there (freely available through the United States Geological Survey). Up until 2014, global coverage of the SRTM DEM was available at a 90m resolution. Since then the 30m version of the same elevation model has been released for the entire globe.
But what do these resolution numbers stand for? We can start to see what is meant when we zoom in beyond the maximum (or native) resolution of a dataset. We now see a pixelated view of the image, because every square-shaped point in the data is covered by multiple pixels on the screen. If we zoom in even further, the data turns into numerous squares. Figure 1 shows actual SRTM DEM data, zoomed in far beyond the maximum resolution, with 90m data on the left, and 30m data on the right.
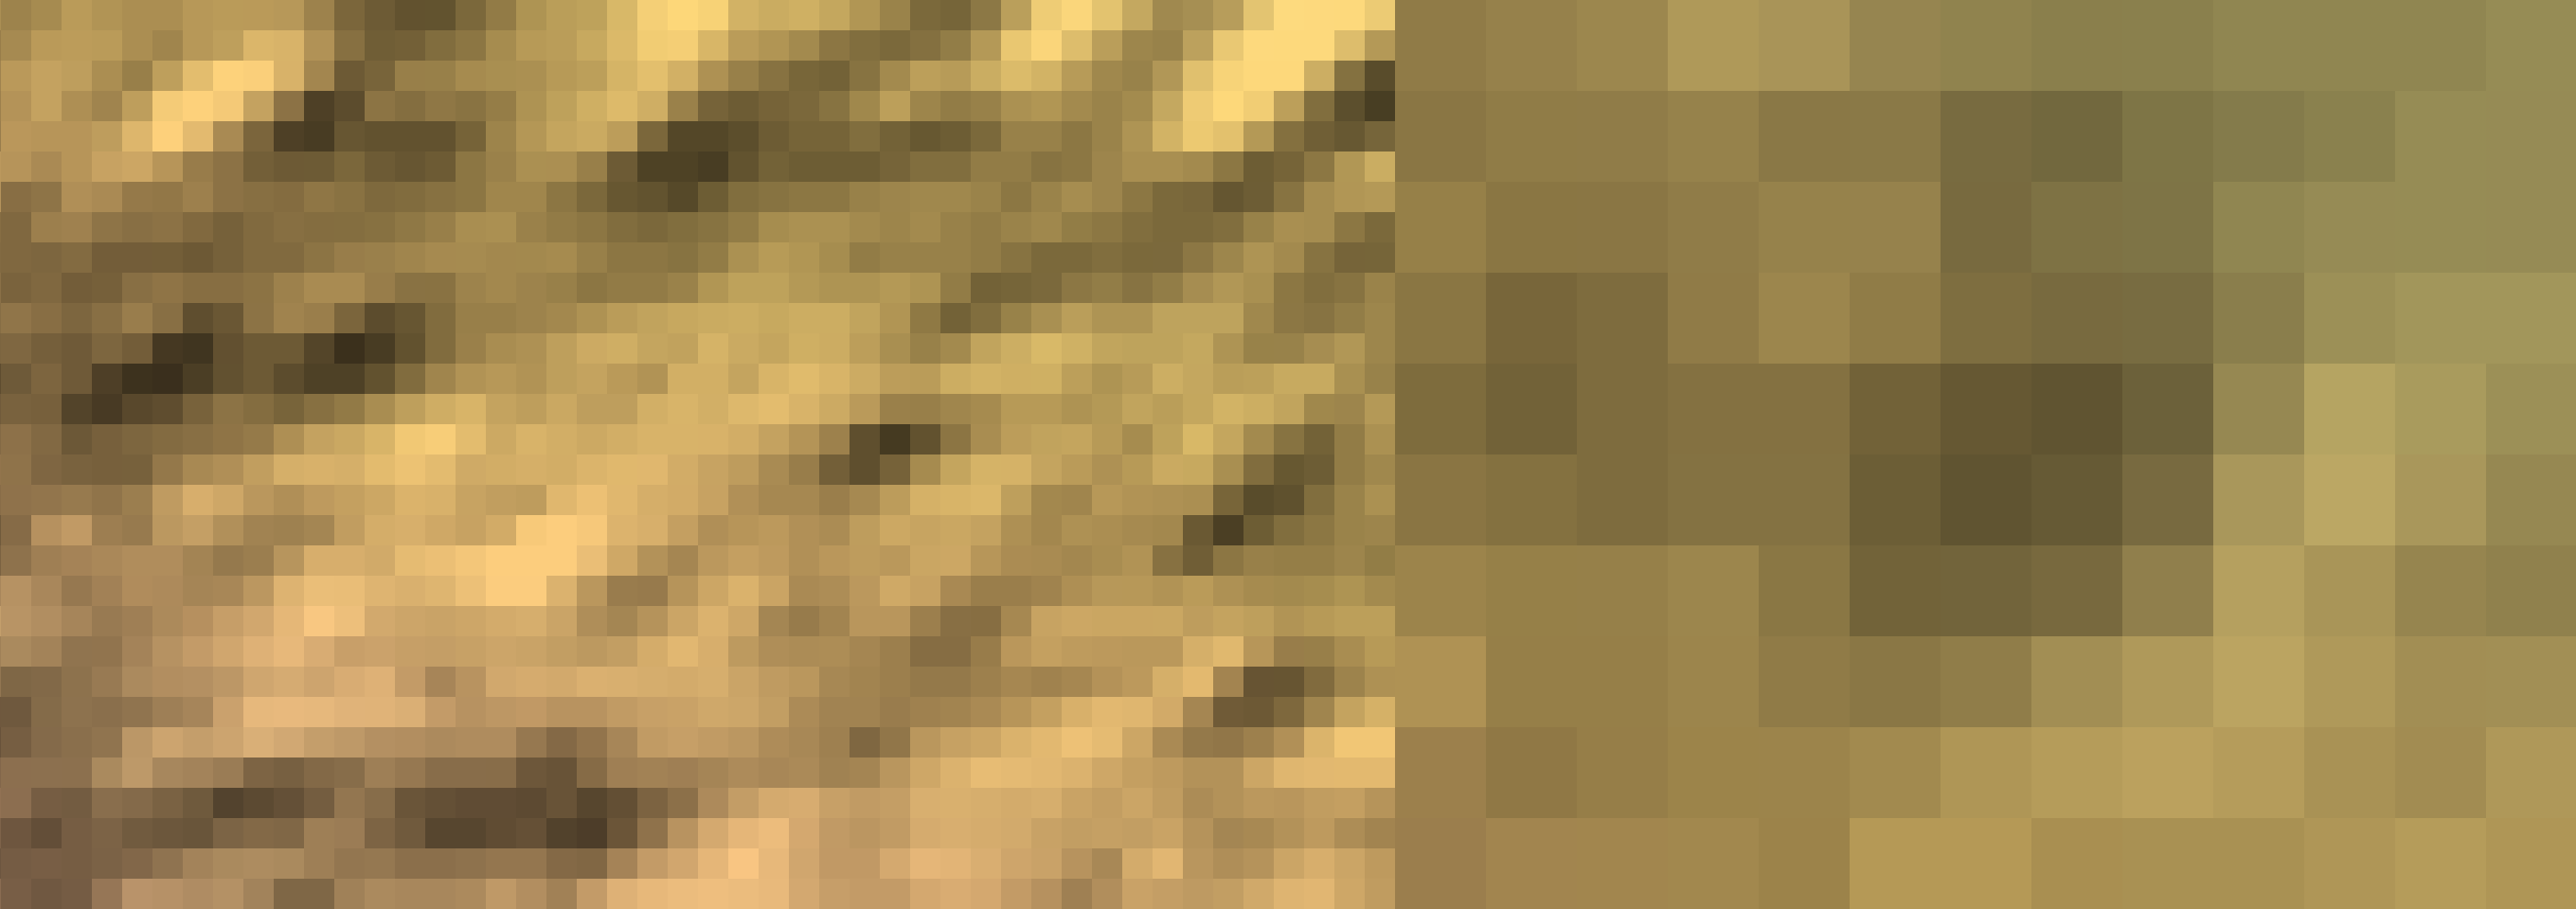
Figure 1; This is what SRTM data looks like when zoomed in far beyond the maximum resolution, with 90m data on the left, and 30m data on the right.
Figure 2 shows what the square shaped pixels would look like, if we were to visualize the difference schematically.
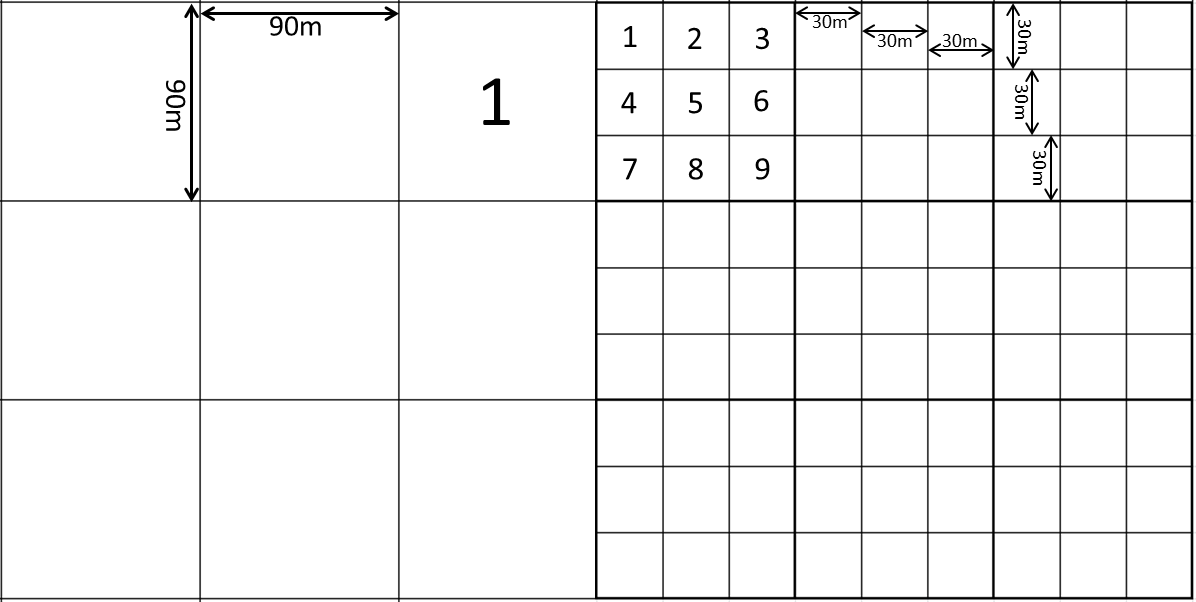
Figure 2; Schematic overview of the change between satellite data with a 90m spatial resolution (left), and data with a 30m resolution (right).
What figures 1 & 2 show is that the spatial resolution is measured by taking the length of a side of one of the square-shaped data points. Simply put, the resolution number refers to only one side of a square. There is another side with the same length as well. For the SRTM example, the former 90m spatial resolution was in fact 90m x 90m, while the current 30m is really 30m x 30m. By making some simple calculations, we can start to better understand the importance of spatial resolution: each data point was 90m x 90m, or 8100m2, and it has changed to 30m x 30m, or 900m2.
Figure 2 shows visually how big this difference really is. Each data point at a 90m resolution is covered by 9 data points at a 30m resolution. What this means is that 30m data is not just three times better than 90m data (as the individual resolution number would make you believe), but nearly an order of magnitude better. Nearly an order of magnitude more data, which means nearly 10 times as much information for the end user. The higher resolution data gives you much more detail over the same area. With this dataset it is possible to detect features that were too small to appear on the lower resolution data and the confidence in the information and interpretations that you derive from your data increases significantly.
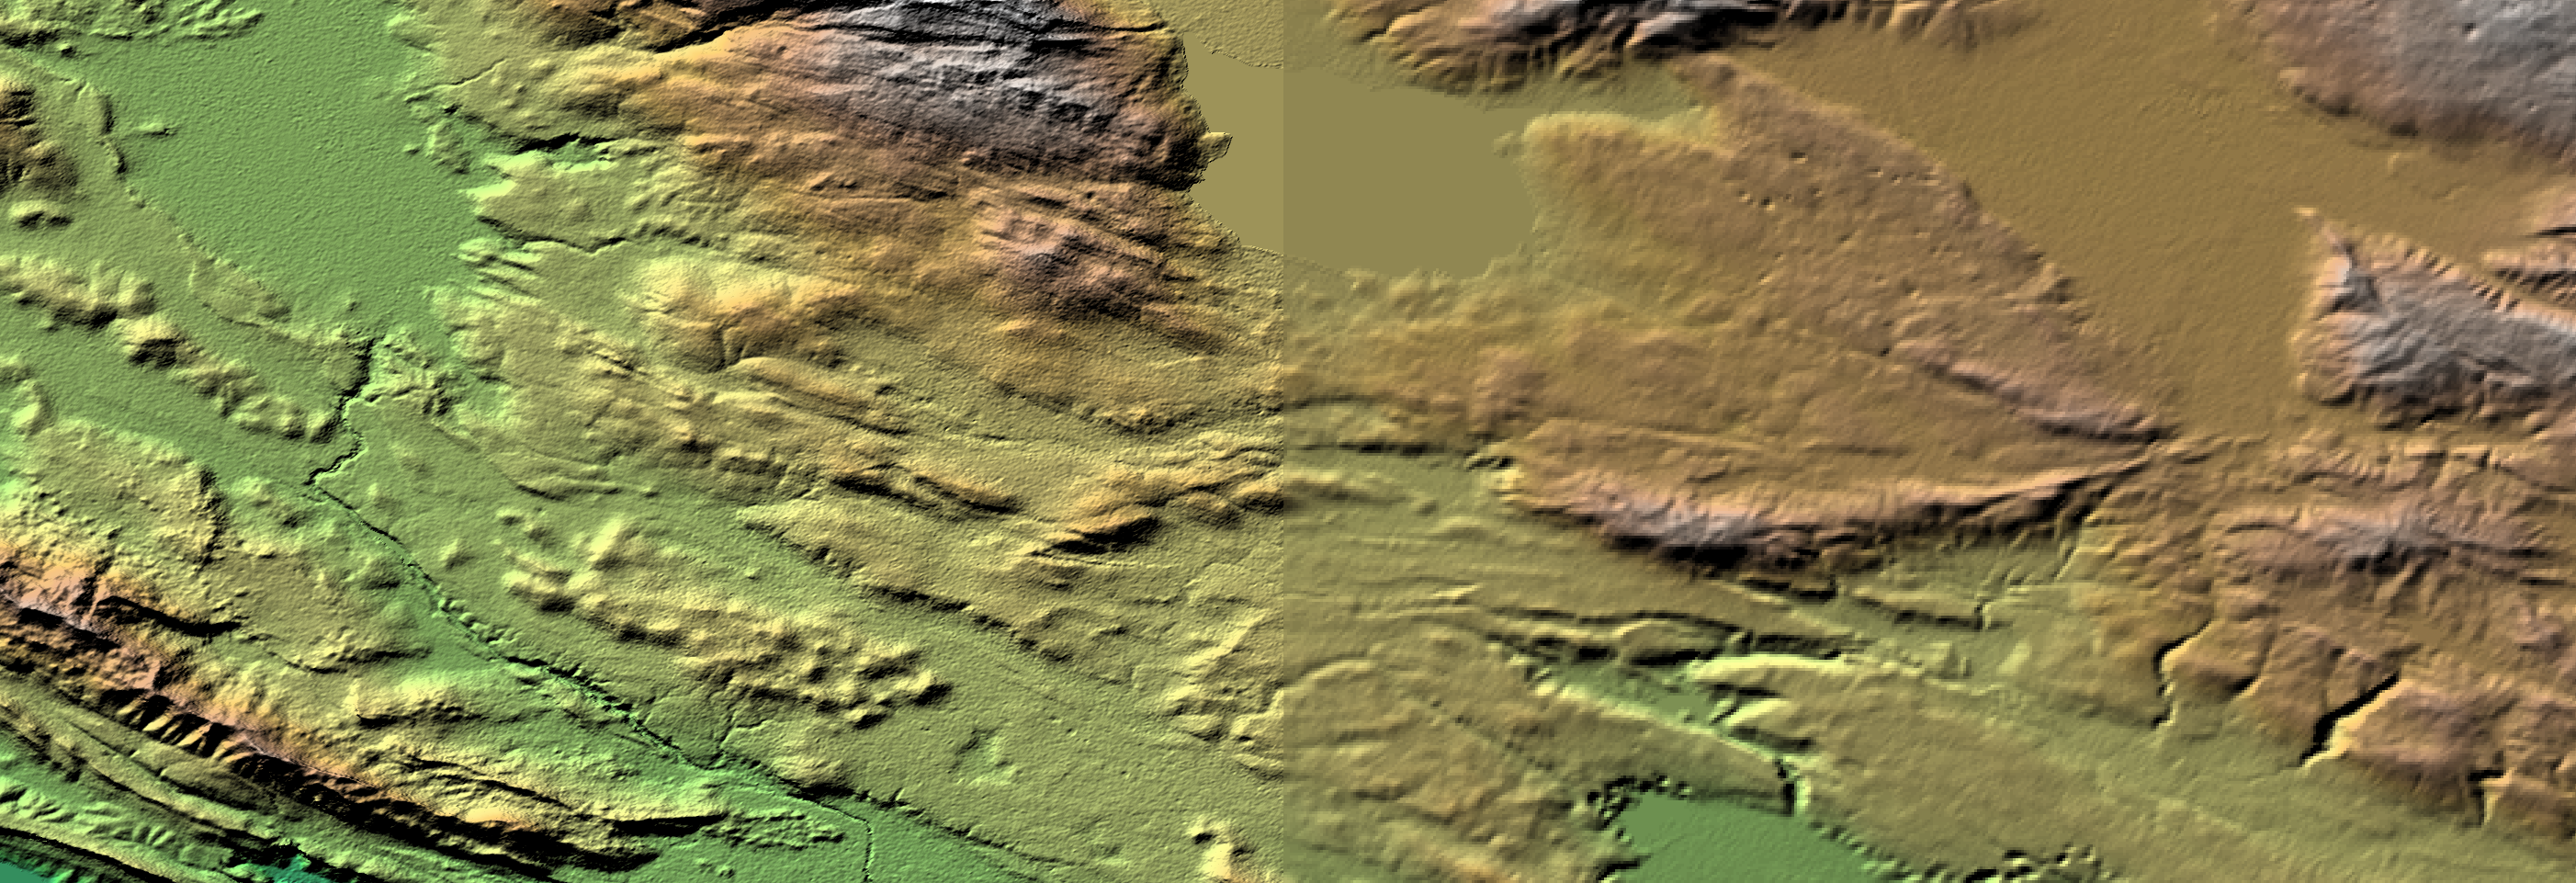
Figure 3 shows an example at a more commonly used zoom level. It is again SRTM data at two different resolutions (90m & 30m), over an area along the border between Croatia and Bosnia-Herzegovina (see figure 4 for location). This image clearly shows that the lower resolution data (along top and right-hand side of image) is much more pixelated, and that the higher resolution data provides much more detail to the user. With regards to geology, details such as coarse layering of the exposed bedrock, minor faults that only have a small offset of the layers, small streams that erode their way into the bedrock and subtle changes in the direction of a river are all captured in the 30m data, while they remain invisible in the 90m data. These aspects are all very useful information when making a structural interpretation of an area, as they allow for a more accurate overall understanding of the structural setting of the area, and for the mapping of an increased number of individual structures during the interpretation. These aspects can be very important, for example when trying to understand the structural setting at the time of mineralization.
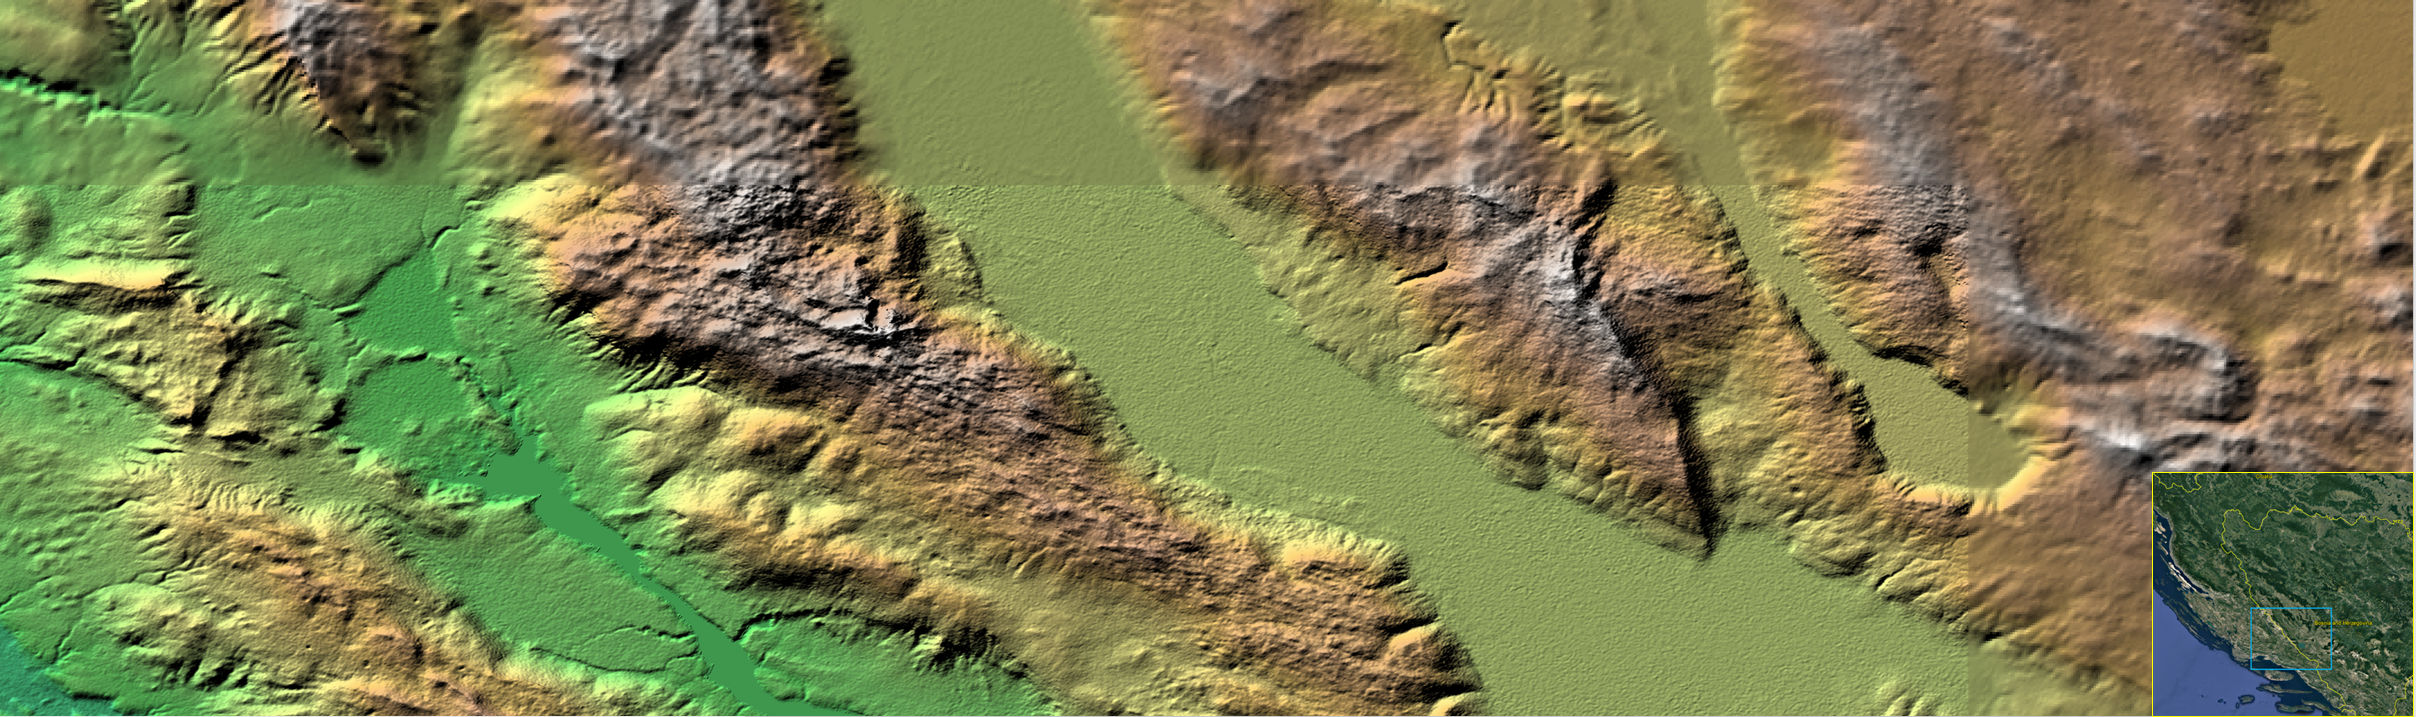
Figure 3; SRTM data over an area along the border between Croatia and Bosnia-Herzegovina. The clear data (center, left & bottom) is 30m data, while the fuzzy data (top & right of figure) is 90m data.
Data options and trends
While 30m elevation data is adequate for applications such as regional geological mapping projects (for example during the early stages of exploration), when a higher level of detail is needed (for example when mapping individual structures that control mineralization locally) it simply doesn’t suffice. For that purpose, numerous other elevation models are available, either for the entire globe, or for specific regions. The following are DEMs we often use at Geosense:
- ALOS World 3D (AW3D) 5m data. A huge improvement over 30m data, and very cost effective compared to most other options.
- WorldDEM (from Airbus) 12m data. A DEM derived from radar data. While more expensive than AW3D 5m data, when working in heavily vegetated terrain this can be a better option, as the cloud cover often affects DEMs derived from imagery (such as AW3D). Even under those difficult circumstances, WorldDEM provides a high vertical accuracy.
- For applications that need an even higher resolution (~1m and beyond), multiple options are available, mostly derived from Very High Resolution (VHR) imagery (such as WorldView, Pleiades, GeoEye, etc.).
Of course, these higher resolution datasets come at a cost; generally, datasets get more expensive, the higher the spatial resolution becomes. But in most cases, you would also use them for different applications, over smaller areas.
For applications that need a level of detail beyond the limit of currently available satellite elevation data, airborne acquisition techniques are available (LiDAR or UAV (drone) based photogrammetry). Advantages of using airborne technologies over satellite-based datasets are the increased flexibility (acquisition date and time of day, flight spacing and direction, revisit times, etc.), and the possibility to acquire data at an angle (particularly useful in areas with steep slopes). In the case of LiDAR, specific processing methods can strip away the vegetation cover. This is very useful for geological mapping in vegetated terrain, as the end result is an elevation model of the surface beneath the trees, rather than the top of the canopy.
Depending on your area of interest, it is worth checking public sources of local remote sensing data, as some governments make high resolution elevation data over their country freely available. One example is Spain. In figure 4, we compare 30m data acquired by satellite (AW3D30), with 5m data from the Instituto Geográfico Nacional (IGN) that is derived from an airborne LiDAR survey (PNOA). In this area in Central Spain, individual features such as stratigraphic layering are clearly visible on the 5m data, while the 30m data only shows the general trend of the mountain ridge. Some of these individual layers have a clear flat-iron shape, which can be used for accurately measuring their strike and dip in some GIS software packages. Two NE-SW oriented faults offset individual layers, and their location can therefore be accurately mapped on the 5m data. Mapping these features would not be possible with the 30m data.
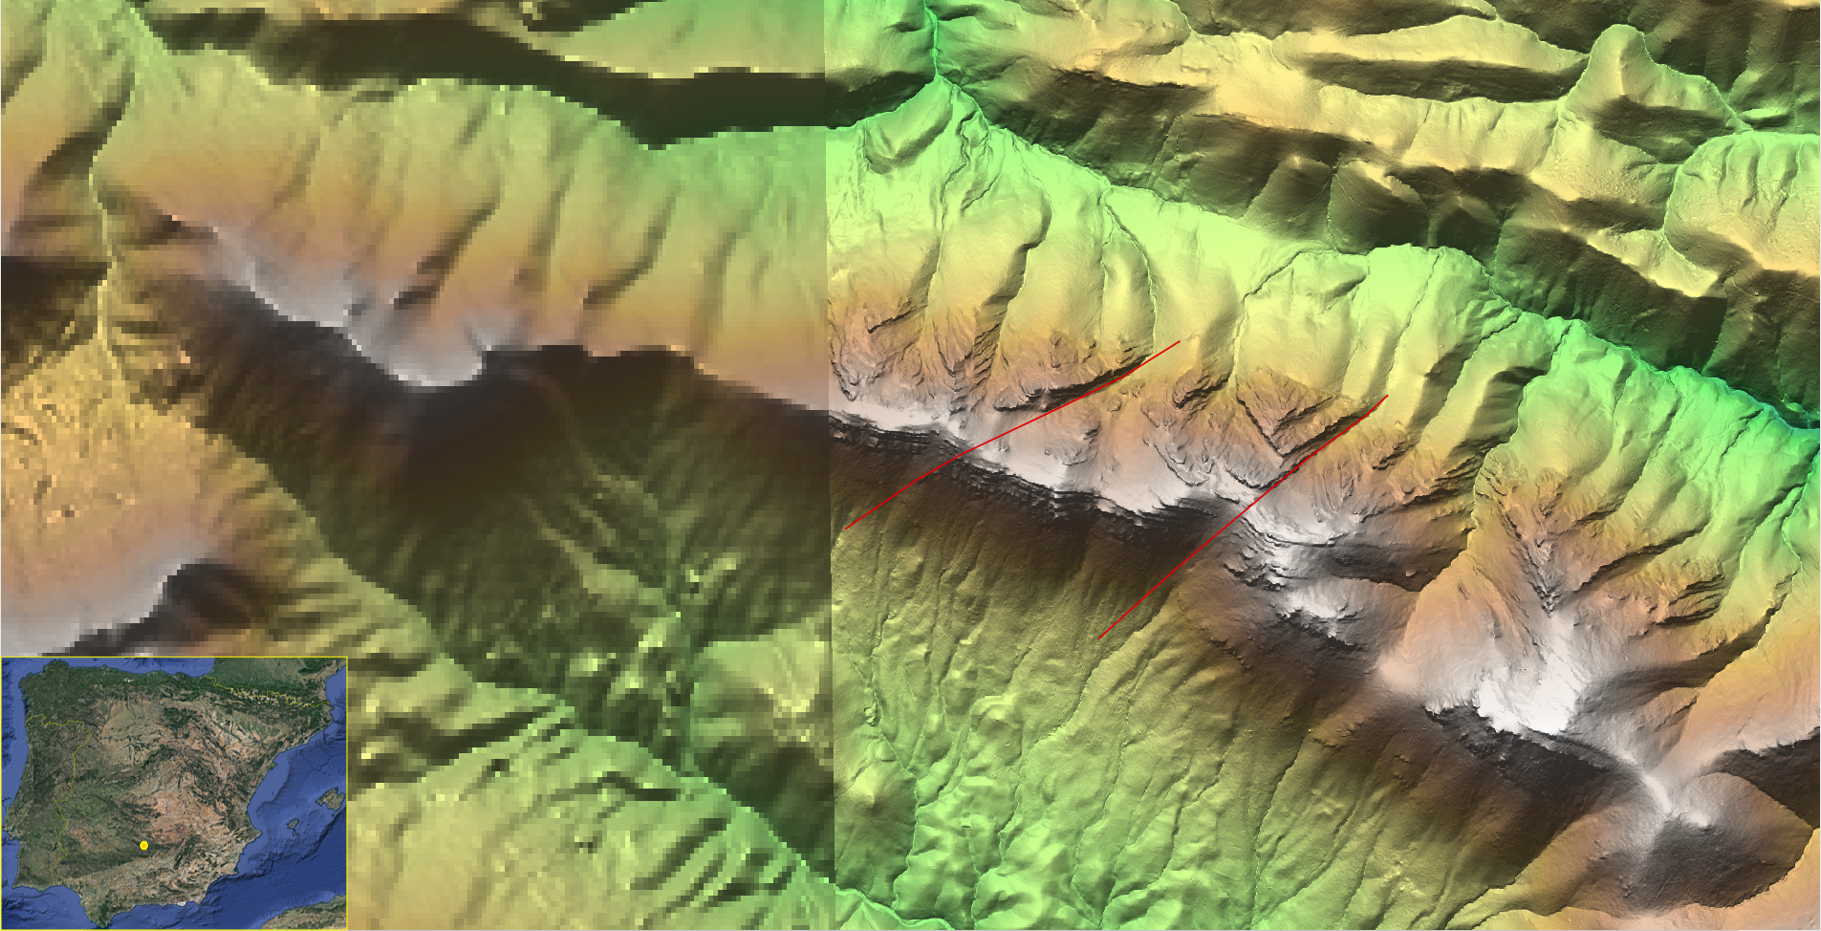
Figure 4; Elevation data over an area in Central Spain. The difference in resolution between the 30m AW3D30 data (left) and the 5m PNOA data (right) is obvious. The higher resolution allows for much more detailed geological mapping, and the interpretation of features with only a subtle surface expression.
At the speed at which changes are occurring in the earth observation sector, it is difficult for people who don’t work with remote sensing data on a daily basis to keep track. And that is a shame, because it makes it more difficult to select the most appropriate dataset for a specific application. With the rising number of satellites looking down at the earth , competition amongst satellite data providers increases as well. As in any industry, more competition means lower prices.
Better quality, higher resolution satellite data is becoming available cheaper than it was before. This trend benefits the end user of the data, but also makes it more difficult to choose the right dataset. To deal with this issue it is important to get advice from people who have both an up-to-date knowledge of available remote sensing datasets, and experience in using the data for the application that the user has in mind. It would be a shame if you were unable to benefit from the ongoing advances on the technical side, simply because you are unaware of the most appropriate data options.
In summary:
- Spatial resolution is measured along the side of a square-shaped data point. Data that has (for example) a 10m resolution has 9 times as many measurements as 30m resolution over the same area, nearly an order of magnitude more!
- Subtle features (such as geological structures, stratigraphic layers) can more accurately and more easily be mapped when using higher resolution data.
- An increased number of data providers has led to an increase in data options and accuracy for DEMs. This trend is likely to continue into the future.
Geological mapping (just like many other applications) has much to benefit from the increased availability and improved resolution of elevation data. Hopefully this article has helped you gain a better understanding of the importance of spatial resolution in remote sensing data. In a future article we will look at various imagery options available nowadays, and the difference that spatial resolution makes for their users. In the meantime, if you have any questions as a result of this article, please don’t hesitate to get in touch.
This article has also been published on LinkedIn.
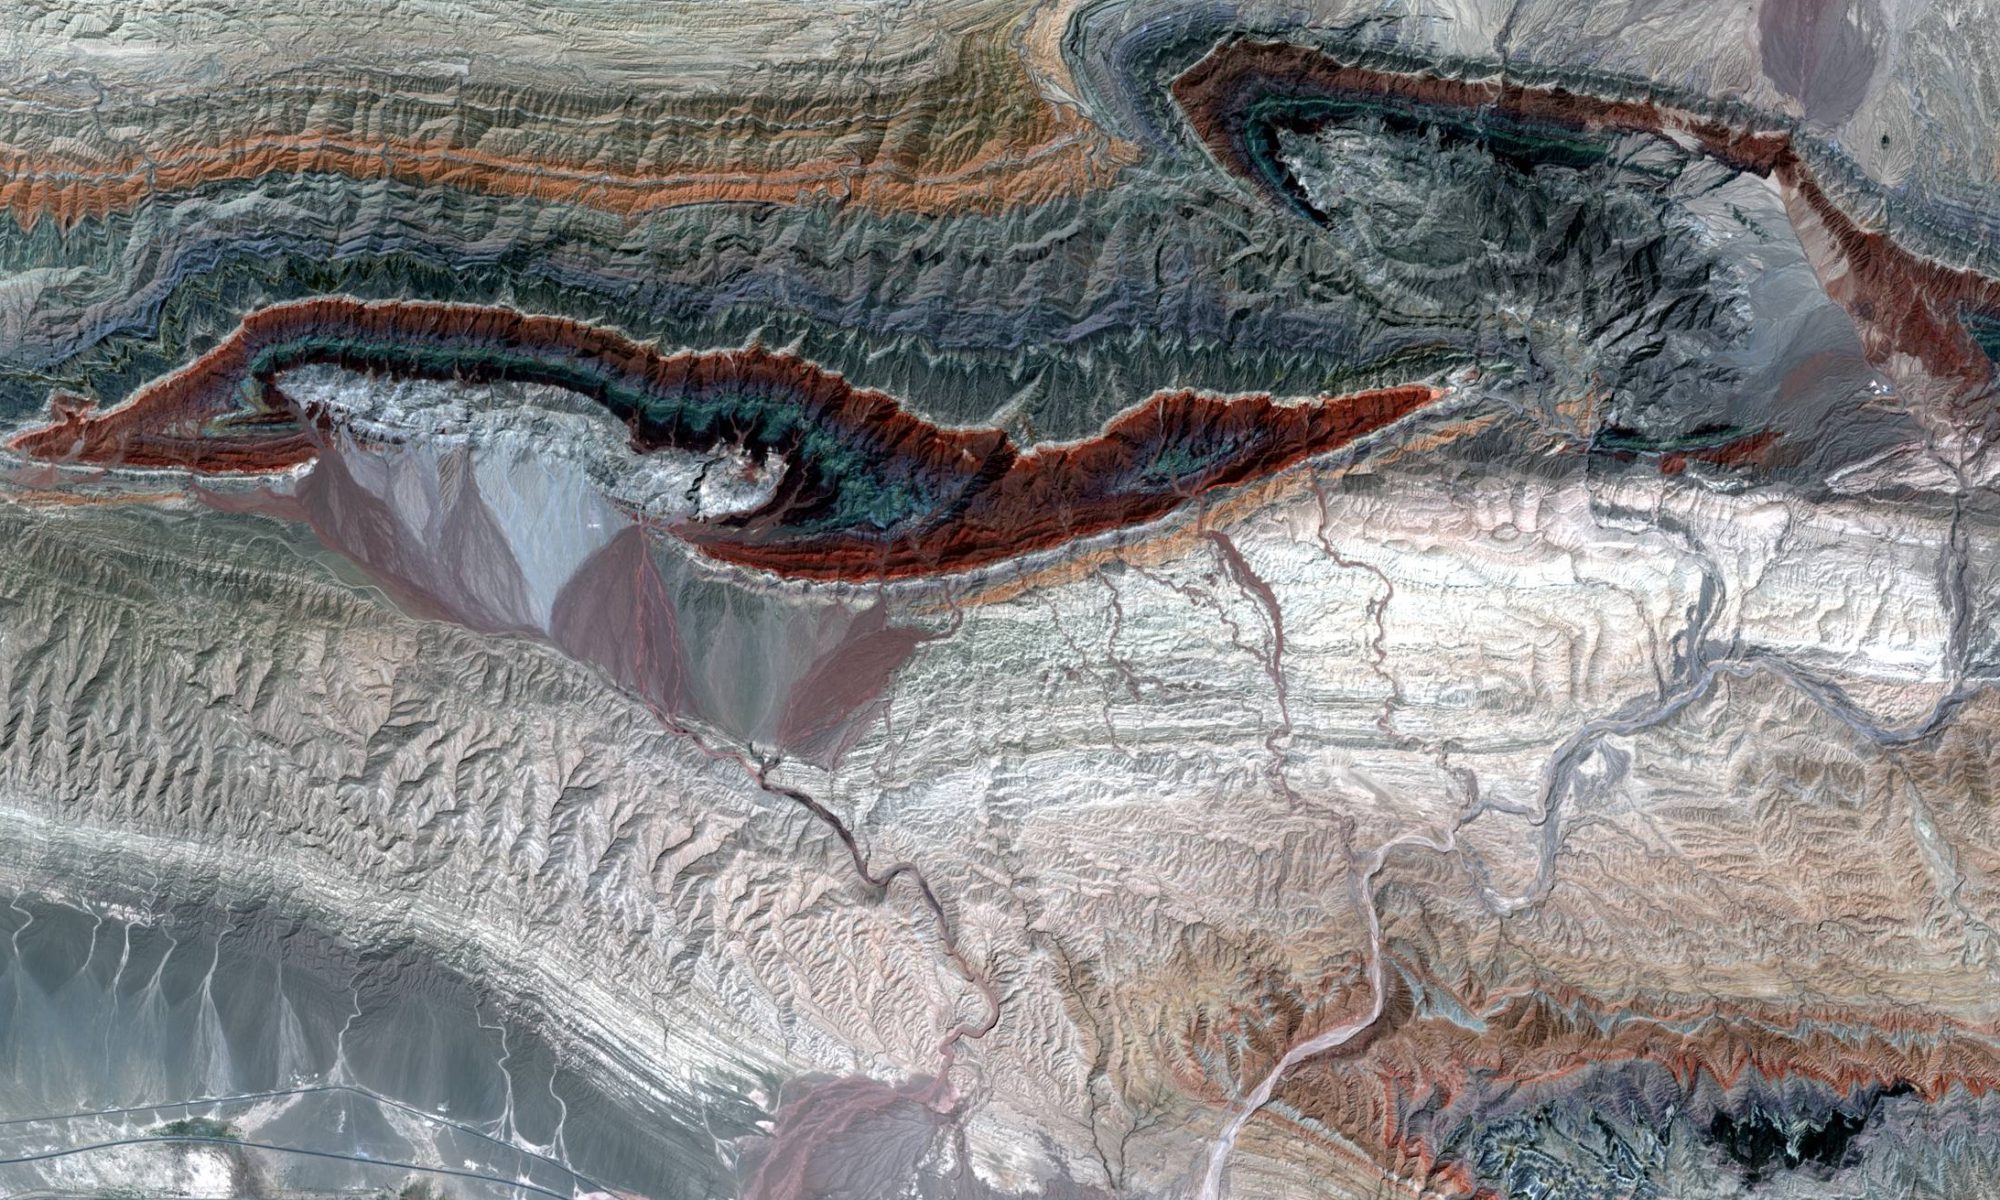
The image at the top of this page is of SRTM DEM data (30m on the left, 90m data on the right) over an area along the border between Croatia and Bosnia and Herzegovina (same region as figure 3).