The availability of hyperspectral imagery is steadily increasing. For mineral exploration, handheld spectrometers and airborne hyperspectral sensors that cover the Short Wave Infra-Red (SWIR) part of the electromagnetic spectrum have been around for many years. SWIR coverage is necessary to map various clays that commonly occur in hydrothermal alteration systems, and help us understand the zonation in temperature and acidity within alteration halos.
For early stage, regional mineral exploration programs, an important development is the increasing number of satellites that carry hyperspectral sensors with both VNIR & SWIR coverage. EnMAP provides excellent hyperspectral satellite data for mapping alteration mineralogy at a regional scale. The spatial resolution is 30 m, with a bandwidth of ~10 nm in the SWIR. These specifications, and the high signal-to-noise ratio of the sensor, enable accurate mapping of a number of important alteration minerals. Where exposure at surface is good enough, even compositional and crystallinity changes within some of these minerals can be determined.
Rather than writing long texts about EnMAP’s capabilities and the possibilities of using this data for mineral exploration, at Geosense we decided to let the images speak for themselves. This is the first of a number of posts that will show EnMAP imagery over geologically interesting regions.
If you would like to know more about geological remote sensing for mineral exploration, and more specifically the use of EnMAP (or other multi- or hyperspectral imagery) , please don’t hesitate to get in touch.
El Salvador – Chile
The first example is from the Indio Muerto district, in Northern Chile. The biggest mine in this district, El Salvador, has been in production since 1959. At least four Eocene porphyry centers have been recognized, emplaced into Cretaceous-Cenozoic volcanic rocks (mainly andesites, rhyolites & ignimbrites). As a result of the individual porphyry stocks, there are overprinting relationships of alteration assemblages. Erosion has exposed these porphyry deposits at surface, and an important zone of supergene mineralization was formed above the hypogene mineralization.
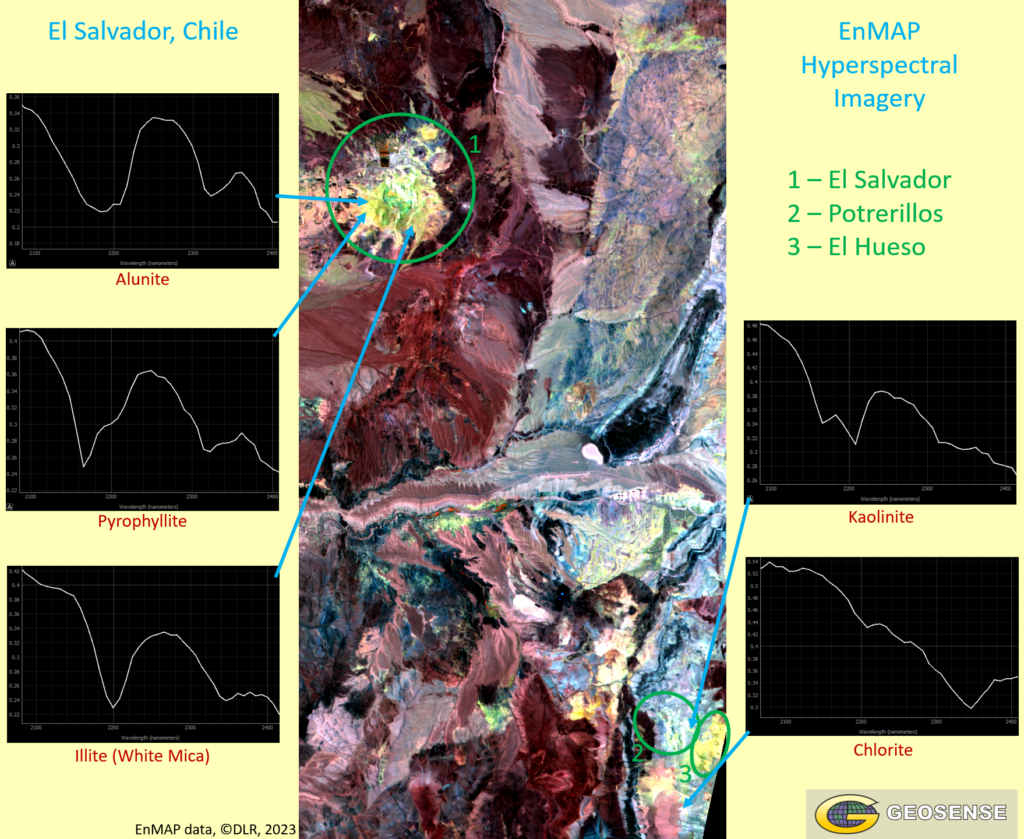
About 30 km to the SE of El Salvador, is a smaller porphyry deposit called Potrerillos, which produced copper for several decades in the 20th century. Near Potrerillos is a High-Sulphidation Epithermal gold deposit called El Hueso (on edge of current EnMAP image).
Several important alteration minerals can clearly be recognized in the spectral curves provided by the EnMAP imagery. Examples of Alunite, Chlorite, Illite (in spectral studies often referred to as “white mica”), Kaolinite and Pyrophyllite are shown. Numerous pixels within these alteration zones show other minerals, or mixtures of the mentioned minerals.
Other alteration zones (some partly hidden under a cover of younger deposits) can be recognized in the area.
This example was also published on LinkedIn.
Death Valley, California
A previous paragraph showed the clay alteration minerals associated with the El Salvador porphyry deposit, in the Indio Muerto district (Chile). The minerals mentioned there (illite, kaolinite, alunite, pyrophyllite & chlorite), are important for detecting various deposit types, most notably porphyry & epithermal deposits. Aside from those minerals, hyperspectral imagery that covers VNIR & SWIR also allows us to recognize various carbonates minerals, including calcite & dolomite. This can be useful for distinguishing stratigraphic units and alteration zones (e.g., calcite in marbles around skarns, and dolomitization associated with MVT deposits).
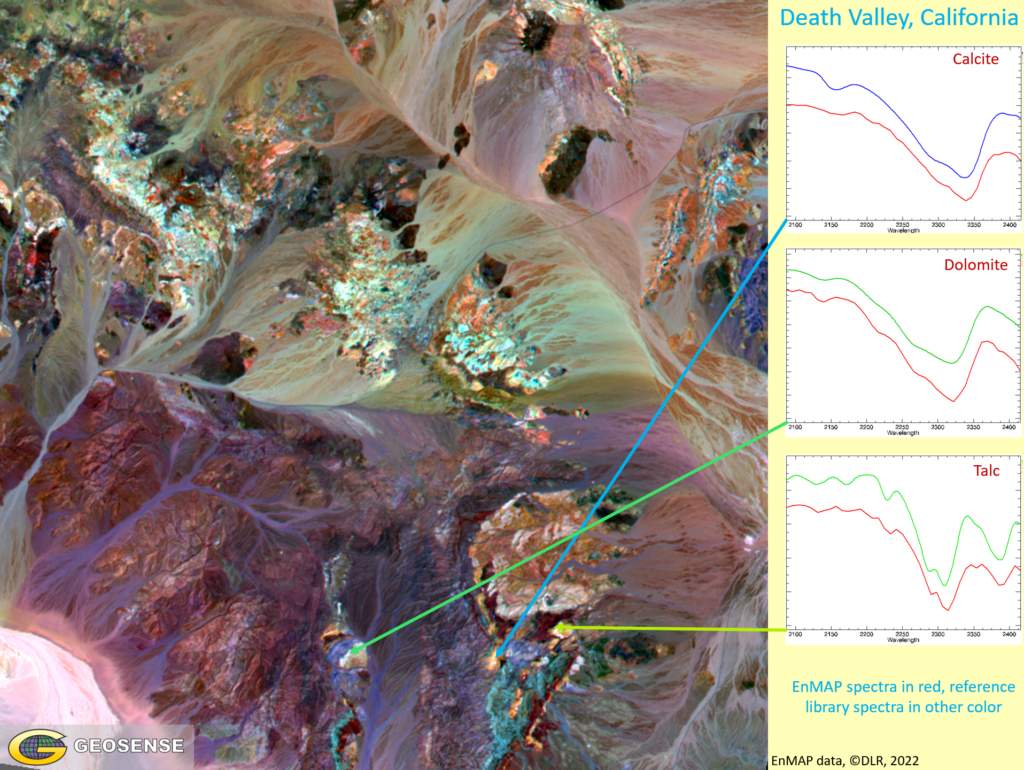
This EnMAP image is from the Ibex Hills in Death Valley (California), geologically part of the Basin and Range Province. Due to the complex geologic history of this area, a wide variety of lithologies is exposed at surface. In the Ibex Hills, a Mesoproterozoic metamorphic and crystalline basement is overlain by a succession of Mesoproterozoic – Paleozoic sedimentary rocks, deposited in a passive margin setting. The lower part of the Mesoproterozoic Crystal Springs Formation was intruded by mafic sills. In the Mesozoic, the region underwent intense compression, which caused folding and thrusting. In the Cenozoic, complex extension occurred in the Basin and Range region, accompanied by igneous activity that led to the extrusion of large amounts of volcanic rocks, deposited unconformably over older units. The outcome of these phases of deformation and igneous activity on the Ibex Hills is a diverse surface geology, locally modified by hydrothermal alteration and contact metamorphism.
The units exposed at surface include calcite & dolomite bearing rocks. In EnMAP imagery (and other SWIR data with a high enough spectral resolution), calcite & dolomite can be differentiated by a shift in the wavelength of characteristic absorption features in the 2,100 – 2,400 nm range. Presence of less common alteration minerals with an important absorption feature in the 2300 – 2350 nm range, such as actinolite and talc, can also be recognized in the SWIR. The detection of these minerals, alongside other carbonate and silicate minerals, can help identify (partly concealed) alteration systems and understand zonation patterns within them.
In the Ibex Hills, there are several old talc mines, which are found along the contact between the lower Crystal Springs formation and the mafic intrusions. EnMAP spectra along this contact clearly show the presence of talc at surface. The spectrum of talc in the SWIR is similar to actinolite, and even the subtle absorption features that differentiate these two minerals are captured in the data. This is clear evidence of the quality of EnMAP imagery, and its usefulness for mineral mapping in hydrothermal alteration systems.
This example was also published on LinkedIn.
Folds & dikes in the Kaoko Belt – Namibia
Hyperspectral imagery is useful to map hydrothermal alteration, including clays and carbonates (see examples above). It can also be used to map other aspects of geology, such as structures and stratigraphy.
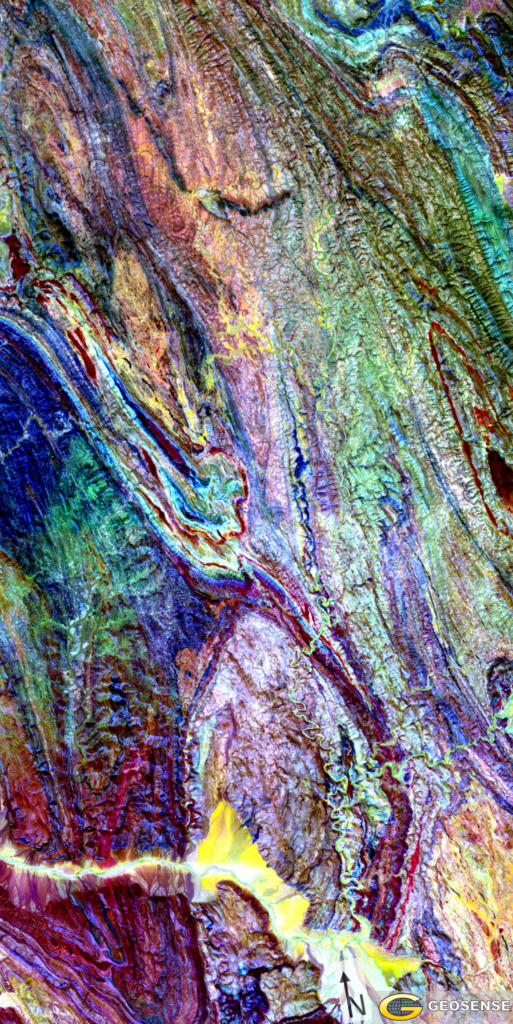
This EnMAP image shows spectacular folds and shear zones within the ~NNW-SSE oriented Kaoko Belt (NW Namibia). These structures are the outcome of the intense deformation that mobile belts undergo, as accommodation zones between rigid cratons that collide. The Kaoko mobile belt was part of the Neoproterozoic Pan-African Orogeny that formed during the accretion of supercontinent Gondwana. Intense folding in the Kaoko Belt initiated during the E-W collision between two rigid blocks; the Angola Block (part of the Congo Craton) and a continent formed by the Rio de la Plata and Paranapanama Cratons (~590 Ma). The shear zones were the result of sinistral transpression, when the combined continental landmass collided with the Kalahari Craton, to the SE (∼550–530 Ma). The intense deformation in the ~ENE-WSW striking Damara mobile belt further to the SE is the main outcome of this second collision.
The Kaoko Belt is divided into three domains, separated from each other by two major ~NNW-SSE striking sinistral shear zones. This EnMAP image shows part of the Central Kaoko Zone (CKZ), an area with mostly orthogneisses and metasedimentary rocks (Archean – Paleoproterozoic) exposed at surface. Both between and within the Kaoko Belt domains, there is a decrease in metamorphic grade from W to E; within the CKZ it grades from amphibolite (W) to greenschist facies (E).
Mobile belts also play an important role in the later stages of a supercontinent cycle, when cratonic blocks move apart. Rifts nucleate along major, steeply dipping structures in these belts, localizing the deformation caused by an extensional stress field. This sequence of events happened in the Kaoko Belt during the Early Cretaceous; steeply dipping shear zones were reactivated as normal faults during rifting. The extension eventually led to the opening of the South Atlantic, where former shear zones now control the geometry of the passive margin. In the Kaoko Belt, rifting was accompanied by significant igneous activity; the Skeleton Coast Dyke Swarm (SCDS) intruded into older units, while flood basalts extruded elsewhere in Namibia and in present-day Brasil. Dikes and flood basalts together form the Paraná-Etendeka Large Igneous Province. Several SCDS mafic dikes are visible in the EnMAP image, mostly (sub-)parallel with the Namibian coastline (~NNW-SSE).
Beyond the structural and stratigraphic information described above, several interesting alteration patterns are visible in the EnMap data (not shown here).
This example was also published on LinkedIn.
Pegmatites near Yellowknife, Northwest Territories, Canada
Previous paragraphs have focused on EnMAP hyperspectral imagery, acquired by a satellite launched in 2022. The >200 spectral bands of EnMAP can be a big improvement for mapping specific aspects of the geology at surface, most importantly alteration mineralogy. To increase your understanding of other aspects of geology, it is important to consider other satellite data sources. Another key dataset is multispectral Sentinel-2 imagery, which has 10 spectral bands; 4 at 10m spatial resolution, and 6 at 20m. For each pixel in EnMAP data, Sentinel provides 9 pixels, an increase of nearly an order of magnitude. It is possible to recognize and accurately map many geological features with Sentinel-2 imagery, in any location where the reflectance contrast between lithologies that are exposed at surface (within the wavelength range of one of the spectral bands) is large enough. A big advantage of Sentinel-2 (over most other imagery datasets) is the vast data archives that are available; most of the globe is covered by imagery free of clouds and snow, acquired at a (relatively) high sun angle.
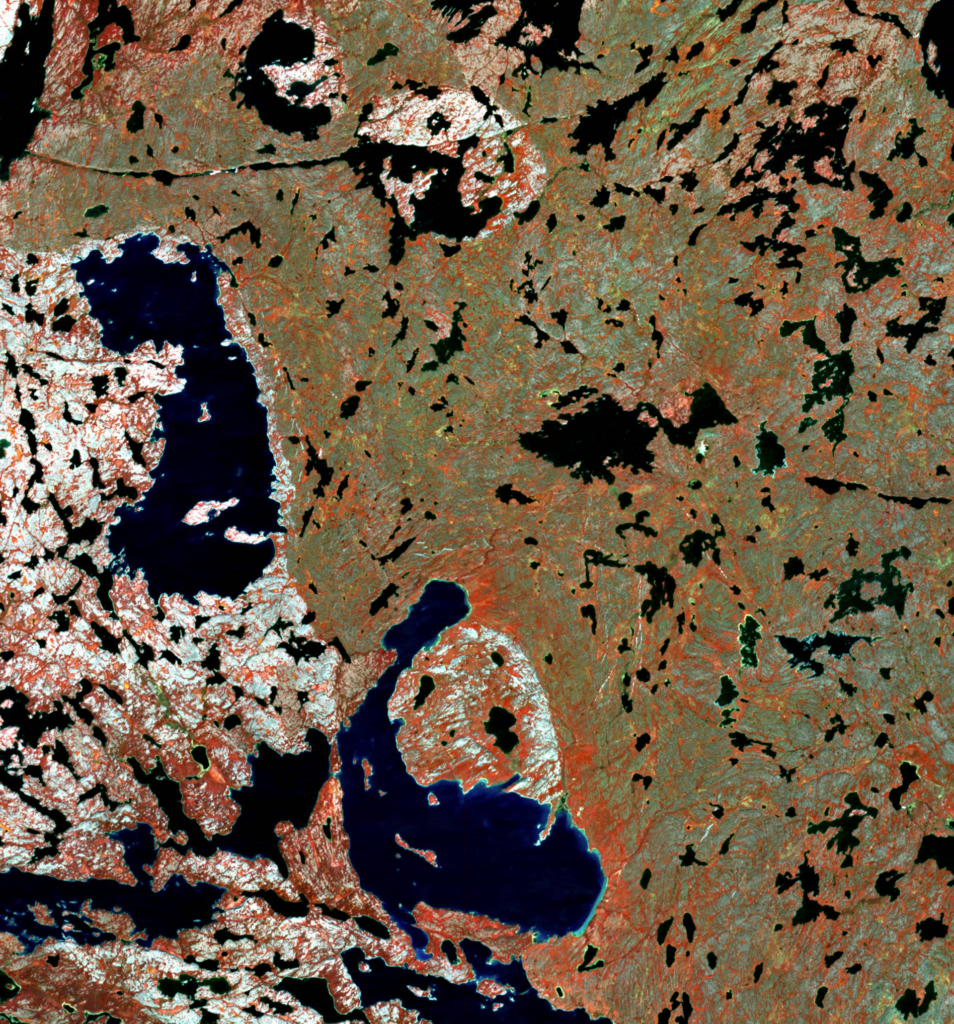
A beautiful example of geological features visible in Sentinel-2 imagery is shown in this false color composite from June 2020, over an area ~50 km NE of Yellowknife, in Canada’s Northwest Territories. In this area Li-FT Power, a company led by Francis MacDonald, is exploring numerous lithium bearing pegmatites. In this area there is significant contrast in composition between the pegmatites and the host rocks (mostly quartz-biotite schists), the pegmatitic dikes are much more resistant against erosion, and form elongated ridges in the terrain, on which development of soils is very limited. The resulting spectral contrast between the host rocks (partly vegetated) and the barren pegmatites is clearly visible in the Sentinel data.
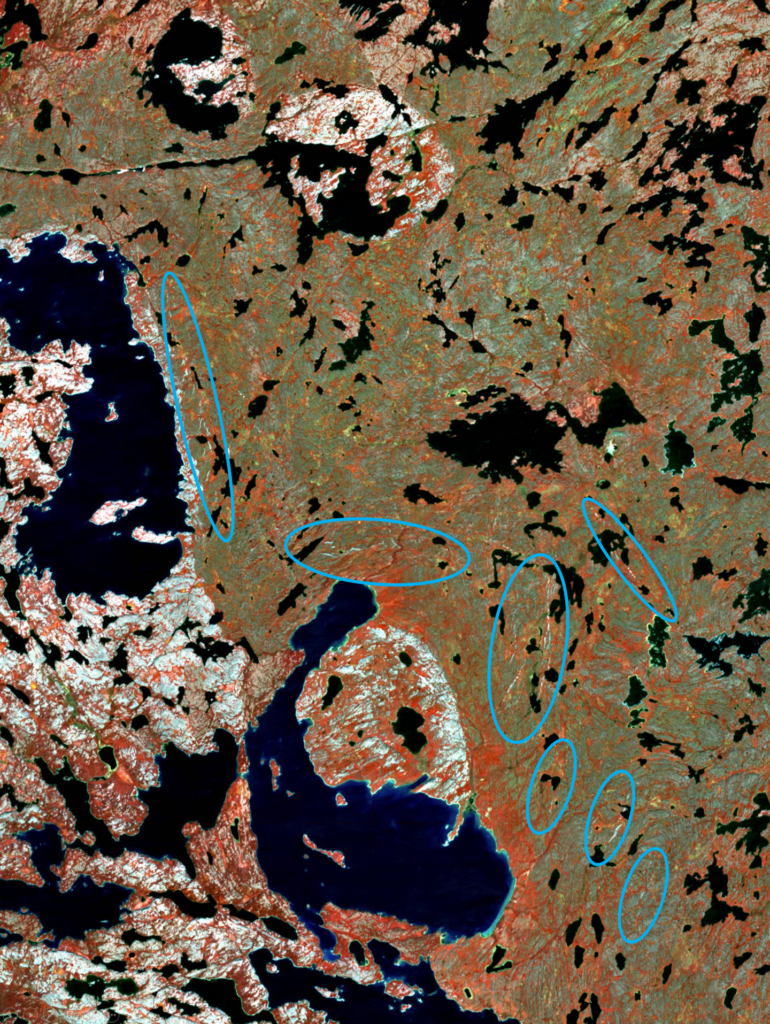
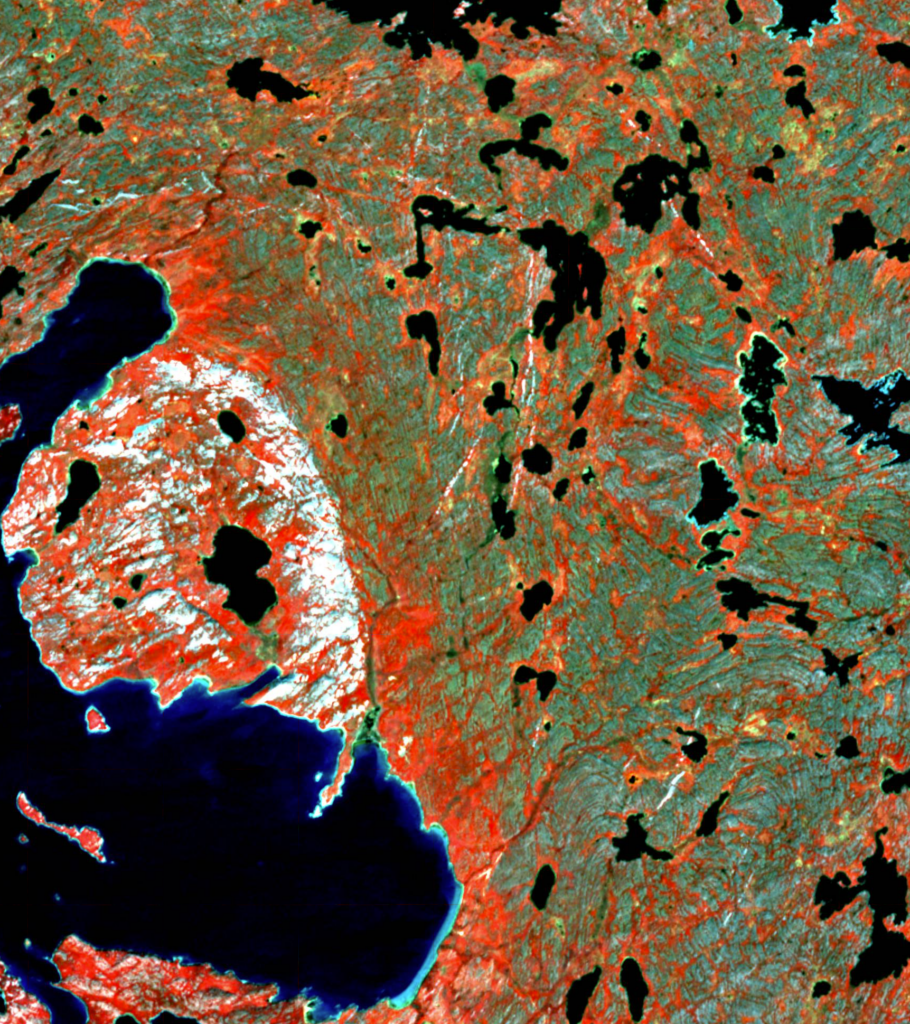
Pegmatites are commonly formed in discontinuities (often structures, such as faults or shear zones) that were present in the rocks prior to the emplacement of the pegmatitic dikes. The resulting pegmatites are typically found in elongated clusters that follow the structures into which the dikes were emplaced (marked by blue ellipses). The longest pegmatite clusters in this region are aligned roughly parallel with the contact between the big batholith (bright & round areas) and the metamorphic rocks (blue/green layered unit).
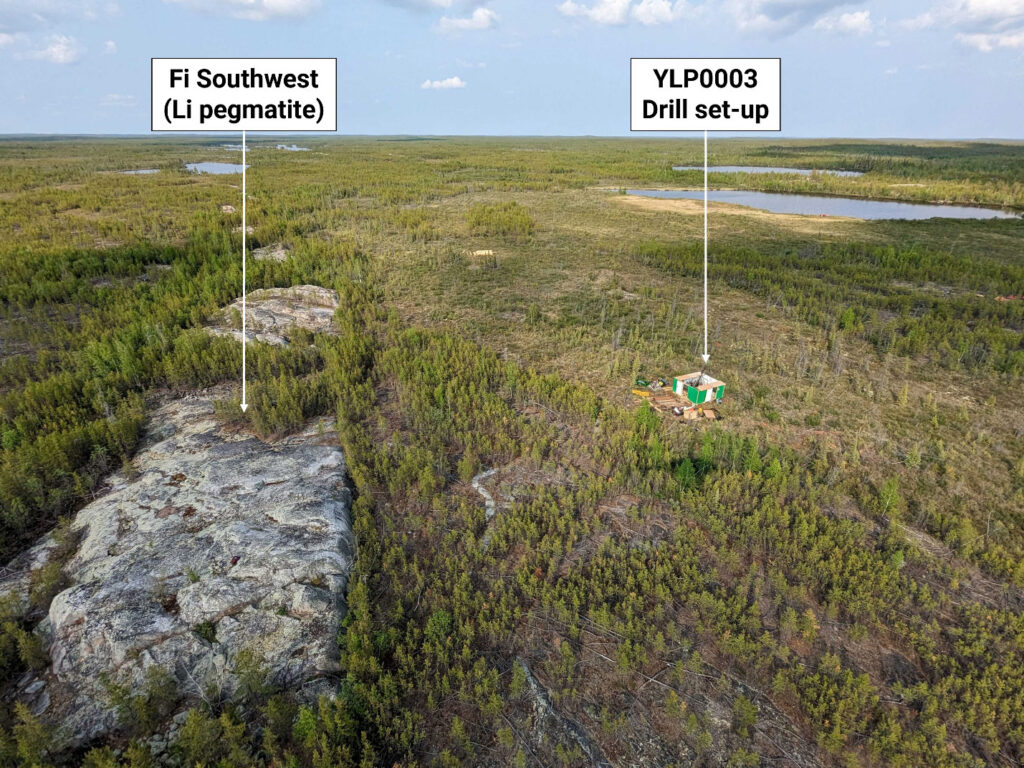
In the Yellowknife region, the thickness of many pegmatites is several 10s of meters, large enough to be clearly visible in Sentinel images. For many geological features that are not as large (up to several meters), numerous other datasets exist that can be used to recognize and map them quickly and accurately.
The last image is from the Li-FT power news release published on June 14, 2023.
This example was also published on LinkedIn.