Introduction
Many giant ore deposits are known to be located in the vicinity of trans-lithospheric structures. The presence of such deep structures, while not a guarantee, seems to be a prerequisite for the development of sizable ore deposits of many types (e.g. Richards, 2003; McCuaig & Hronsky, 2014; Groves & Santosh, 2015). These structures commonly form key pathways (or plumbing systems) for vertical migration of magmas and mineralized fluids through the crust.
In mineral exploration, the importance of predictive targeting keeps increasing, relative to the detection of possible signs of the presence of mineralization. Therefore, the importance of recognizing deep structures also keeps increasing, particularly during early, regional scale exploration (figure 1). Mapping the locations of fundamental lithospheric structures is essential to reducing the size of target area(s), where further exploration should be focused.
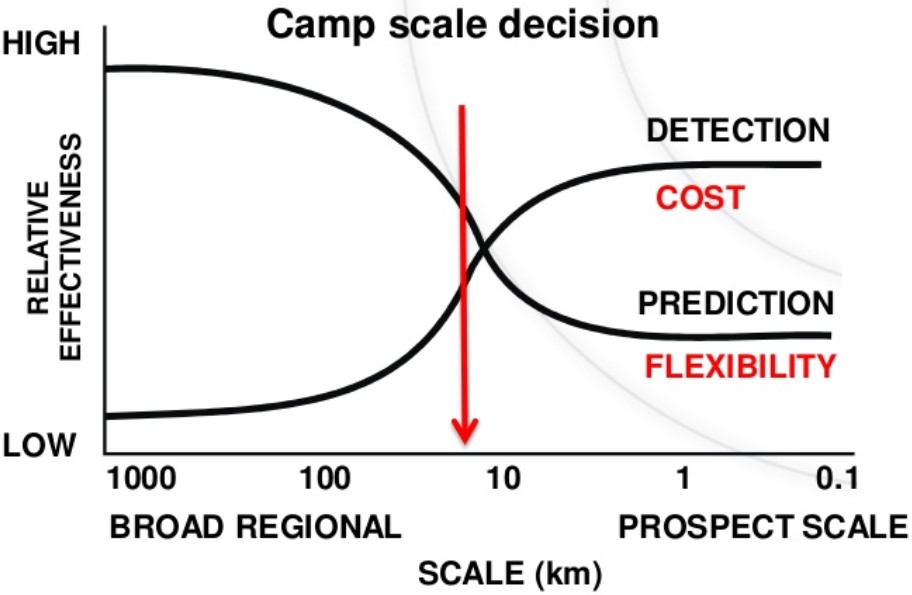
Figure 1: The mapping of fundamental basement structures is particularly relevant during broad regional exploration (left-hand side of diagram), in the early stages of generative exploration programs (McCuaig et al., 2010).
A well-known example of these large-scale ore-controlling structures is the NE-SW oriented Querococha Arch structure (Love et al., 2004) that runs through Antamina, in Peru (figure 2). Other examples of world-class deposits where similar types of structure have been mapped include: Grasberg, OK Tedi and Porgera (New Guinea, see e.g. Hill et al., 2002; Garwin et al., 2005), numerous ore deposits in NW Argentina and N Chile (e.g. Chernicoff et al., 2002; Richards 2003), the Kalgoorlie Super Pit (Yilgarn Craton, West Australia, see e.g. Mole et al., 2012) and several others in Australia (McCuaig & Hronsky, 2014). Possibly the most famous examples of fundamental basement structures that control the locations of giant ore deposits at a regional scale are the Carlin and Battle Mountain-Eureka Trends in the Great Basin of the western US (Grauch et al., 2003).
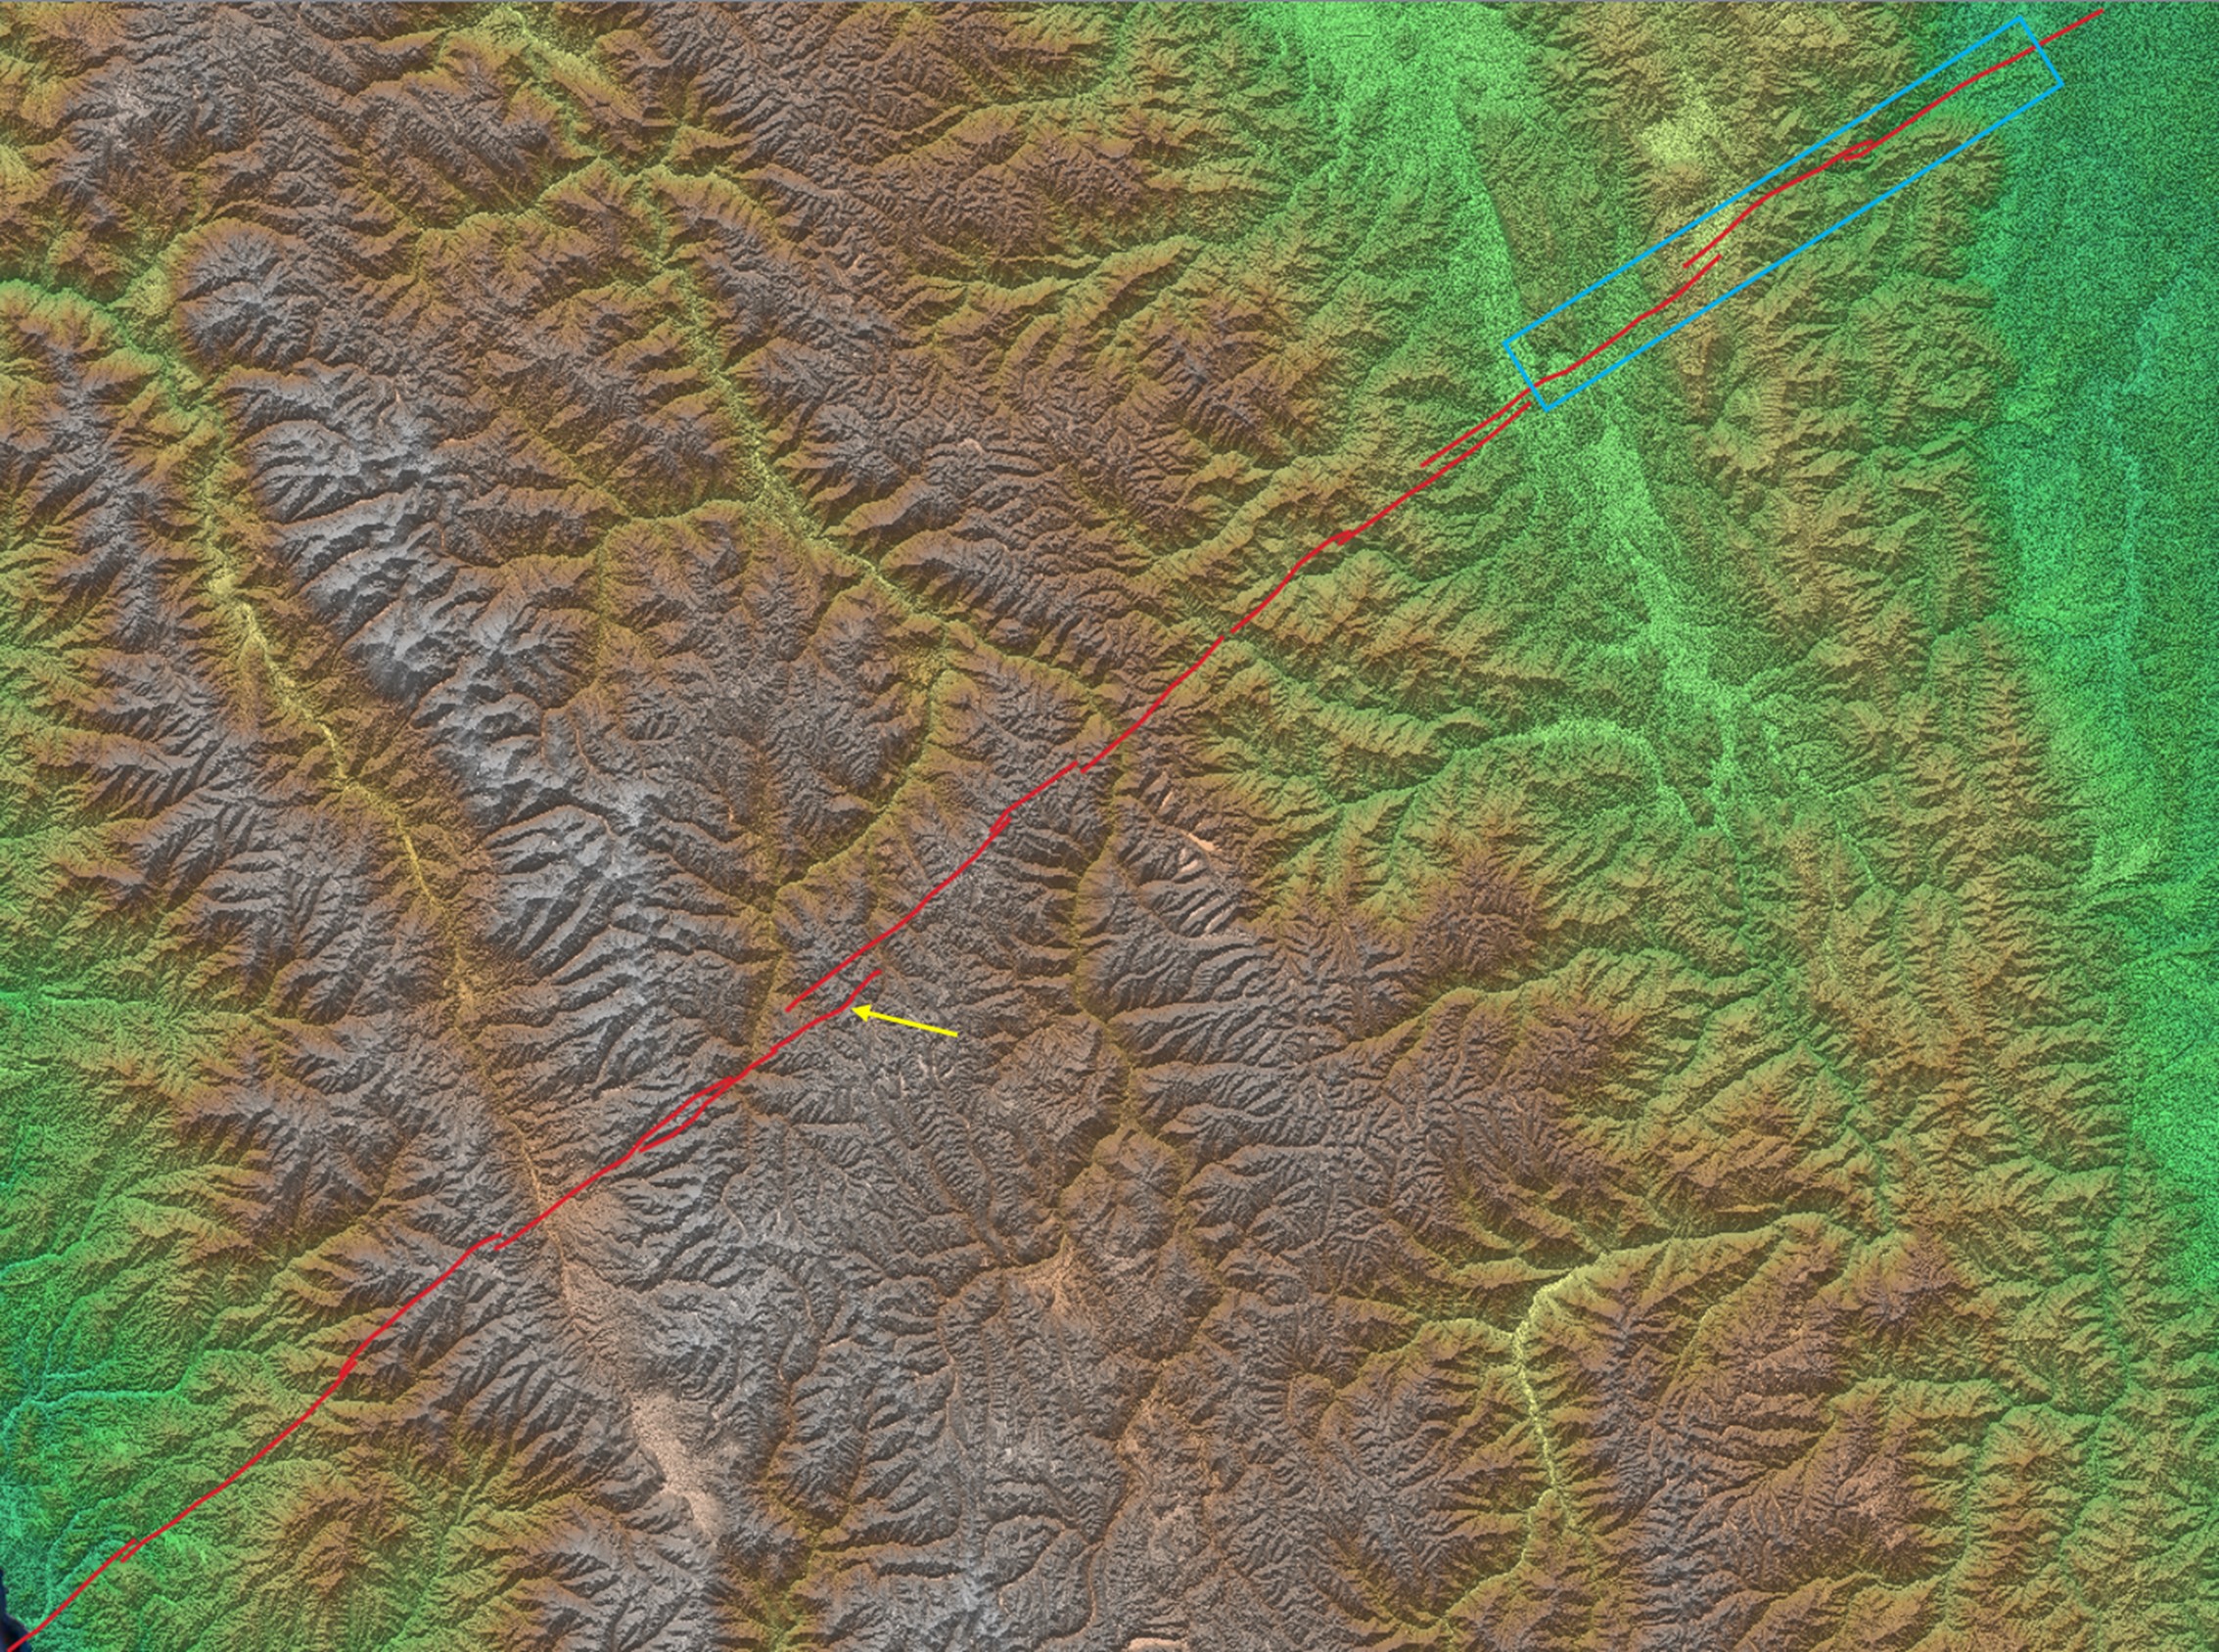
Figure 2: Region around Antamina mine, Peru (yellow arrow). The strike-extensive Querococha Arch structure that runs through the Antamina deposit causes significant deformation along its trace. Deformation changes are most apparent in the area 200 km NE from Antamina (blue box), within the Sub-Andean Fold-Thrust Belt, where obvious changes between deformation geometries on either side of the structure occur (Elevation data used: AW3D30 DEM).
Characteristics of fundamental basement structures
Recent research (e.g. McCuaig & Hronsky, 2014) shows that large-scale ore-controlling structures have a number of common characteristics. They are generally:
- Strike-extensive. When mapped, these structures are significantly longer than the average fault in the same region.
- Depth-extensive (they often reach the lithospheric mantle) with relatively steep dips (as imaged in geophysics). This means they are often fairly straight in map view.
- Commonly juxtapose distinctly different basement domains.
- Multiply-reactivated during different phases of deformation. The sense of movement of these structures upon reactivation depends on the orientation of the prevailing stress field. These structures often undergo variable senses of movement throughout their very long geologic history.
- Vertically-accretive growth histories. Undisturbed younger sedimentary/volcanic deposits (or obducted rocks) can cover the structure during periods of inactivity, but upon reactivation of the underlying structure, such deposits tend to deform along its’ trace. When this deformation succeeds, the basement structure propagates upwards and continues its’ vertical accretion (figure 3).
- These are not necessarily obvious structures at or above the level of mineralization, they can be ‘cryptic’ (hard to see at current erosional levels). The reason for this is that deformation close to the surface is only a reflection of the most recent movement(s) along the structure. In most cases the deeper basement, which has seen larger/multiple/variable movements, isn’t exposed at surface. For this reason, these structures are difficult to recognize when out in the field and have often been missed by geological surveys, or only mapped along part of their trace. Yet during regional exploration, these are the most important structures to try and map, as they are fundamental for targeting more focused exploration work.
Reactivation of fundamental basement structures during extension
Figure 3 shows the upward propagation of a fundamental basement structure after the deposition of sediments and/or volcanic rocks above it in a tectonically inactive environment. The diagrams explain why the movement of these large faults often seems relatively small and their surface expression cryptic.
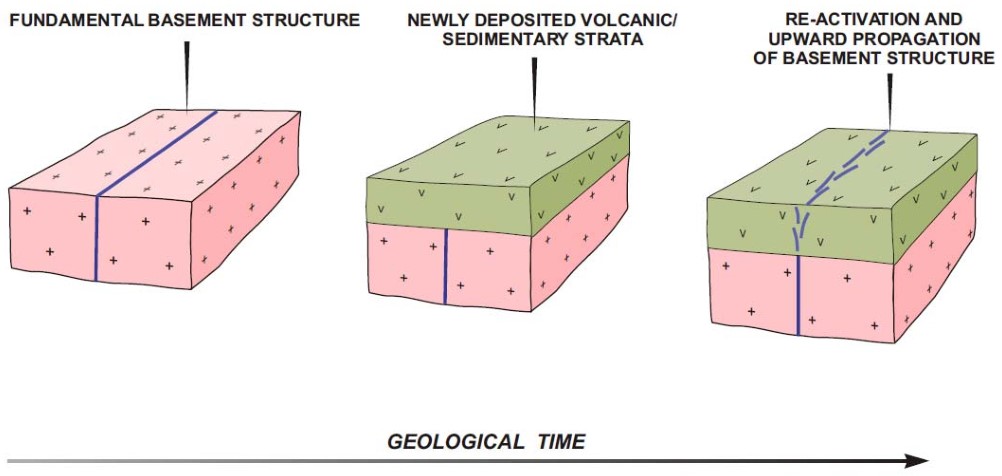
Figure 3: Diagram showing upward propagation of a fundamental basement structure through the deformation of overlying undeformed units upon reactivation of the underlying structure. (McCuaig & Hronsky, 2014)
While the example in figure 3 is valid in many cases, it is important to realize that, during periods of basin formation, fundamental basement structures are often active rather than inactive. The (oblique) extensional stress field under which the formation of most basins initiate is more likely to reactivate large, steep pre-existing weaknesses (if their orientation is favorable, relative to the orientation of the stress field), than it is to form new ones (e.g. Daly et al., 1989; Morley et al., 2004). The vertical (or oblique) movement along fundamental basement structures during deposition of sediments in the newly formed basin causes changes in thicknesses and facies in the sedimentary package. These changes follow the traces of the underlying (reactivated) structures that control them (figures 4 & 5).
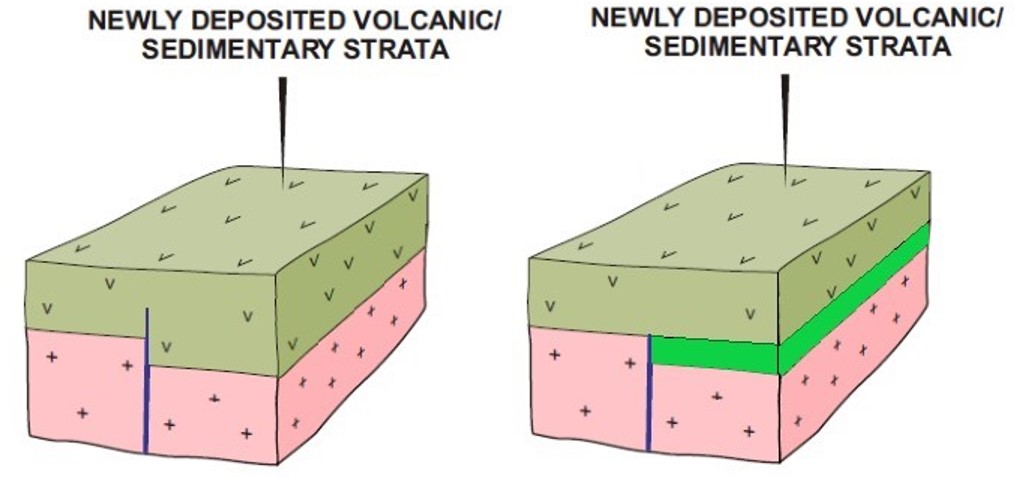
Figure 4: Diagram showing changes in thickness (left) and facies (right) of newly deposited volcanic/sedimentary strata on either side of the underlying structure, during the early stages of basin formation. (Adapted from McCuaig & Hronsky, 2014)
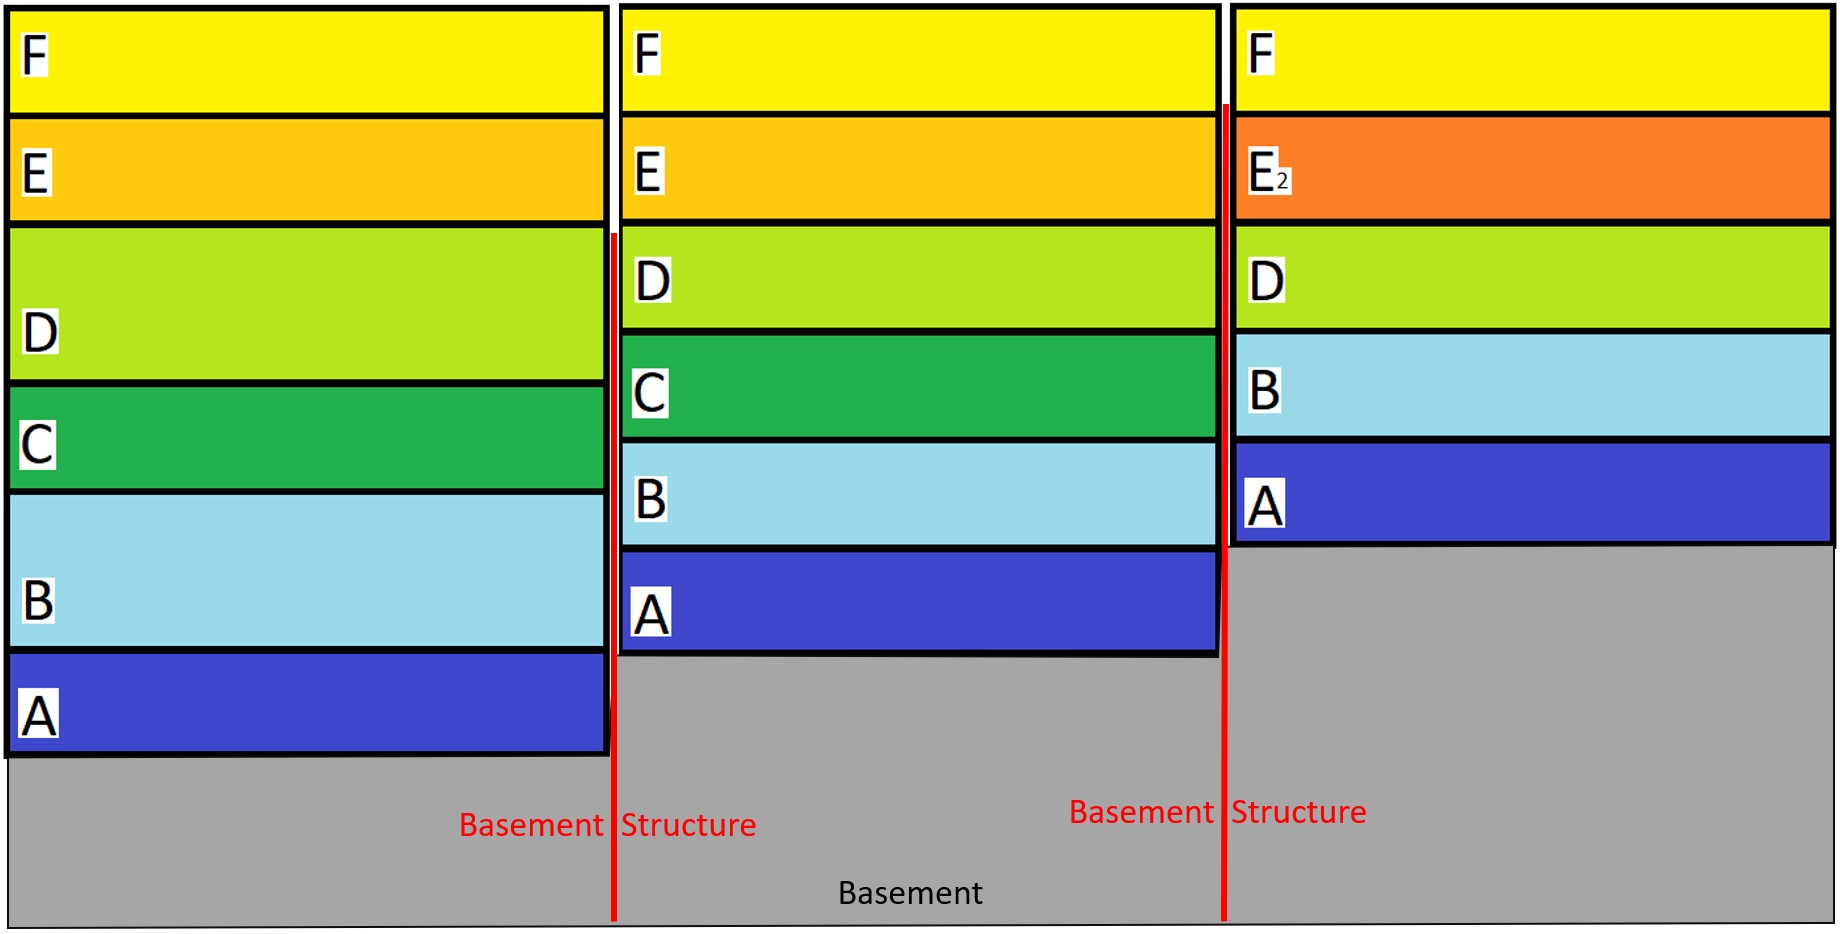
Figure 5: Schematic examples of changes in thickness and facies in the stratigraphic column, caused by reactivation of steep, pre-existing basement structures during basin development.
If such a basin, with changes in the sedimentary package across fundamental basement structures, undergoes significant deformation at a later stage in geologic history, the changes in sediment thickness and facies will have an effect on the deformation style and geometry. If the basin undergoes compression (or transpression), the changes in the stratigraphic column lead to changes in frequency of faults (figure 6), differences in wavelengths of folds (figure 7), changes in dip of flanks of synclines and anticlines and changes in depth, lithology & thickness of detachment levels (again causing changes in frequency, amplitude & geometry of folds, or in more extreme cases changes from thick-to thin skinned tectonics). Lateral ramps in orogenies are a common example of a relatively shallow feature, caused by deeper underlying structures. At surface, these structures are often mapped as strike-slip faults, although in three dimensions, the structural setting tends to be more complex (figure 6).
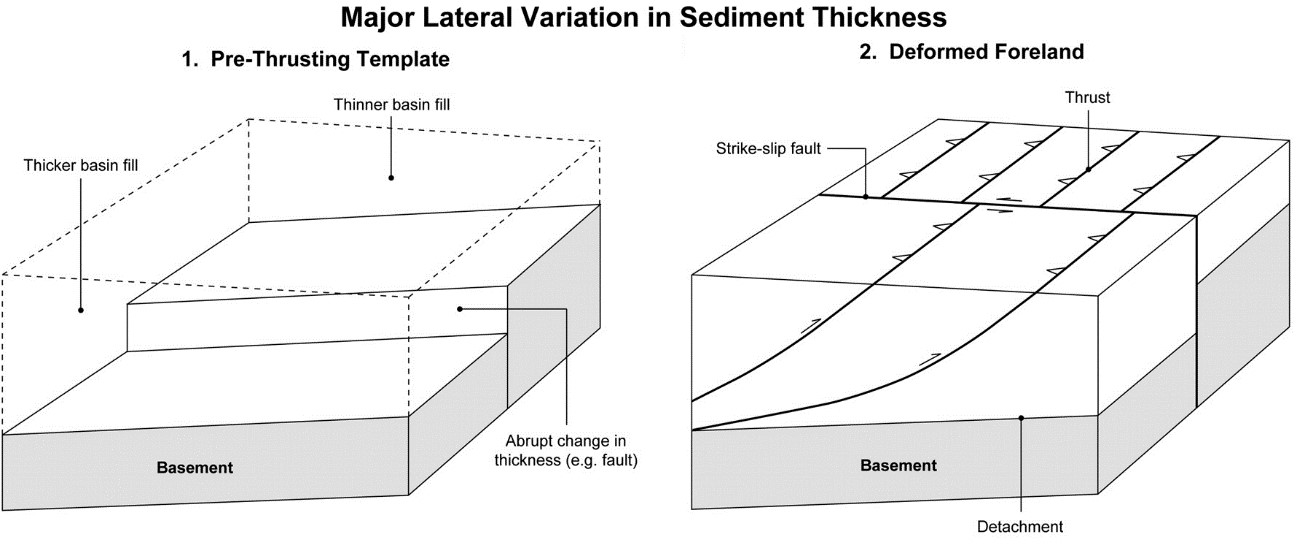
Figure 6: Location of the basement fault, and the resulting changes in sediment thickness and/or facies, results in changes in deformation style and geometry of the overlying sedimentary package (Turner et al., 2010).
The location of the changes in detachment levels overlies the reactivated basement structure, as this structure controls the changes in the stratigraphic column (figures 5 & 6). Working backwards, the described changes in the surface geology, are a reflection of significant underlying changes at depth, and thus indicate the presence of fundamental basement structures. Some of these changes can be recognized and mapped with satellite data.
Methods for mapping of fundamental basement structures
As the location of fundamental basement structures is so important during generative grassroots exploration programs, to help reduce the size of target areas where more detailed exploration should be focused, the ability to recognize them is essential. Currently, their presence is often confirmed through tectono-stratigraphic reconstructions and geophysics. The recognition through reconstruction of a detailed tectono-stratigraphic framework relies on sudden changes in facies and thickness within the sedimentary package of a basin, due to activity of basement structures during their deposition (as explained above). The detection through geophysical methods depends on activity along the basement structures juxtaposing different lithologies (close to the surface and/or at depth), each with different physical characteristics, which are reflected in the geophysical data.
Another very effective and low-cost method for the recognition of fundamental basement structures is geological mapping using satellite data. A top-down view over a large region provides a different perspective, an overview of the area which allows for the detection of mappable elements that are easily missed by geologists while out in the field, or on relatively small footprint aerial photos. Examples of such mappable elements that can be recognized with satellite data are:
- Abrupt changes in the frequency of faults and folds at surface.
- Sudden changes in wavelengths of folds along strike.
- Numerous folds terminate along the surface trace of the basement structure.
- Because of these folds terminating, rivers more commonly cross the strike of the orogen above the basement structure, where away from it, they tend to flow parallel to the strike due to changes in erosion resistance of surface lithologies of the folded layers
- Increased presence of igneous rocks (granites, dykes, volcanoes). Igneous rocks of different ages have been recognized along these structures.
- If mapped by geological surveys along parts of their surface trace, they are often interpreted as simple strike-slip faults.
Antamina basement structure – Perú
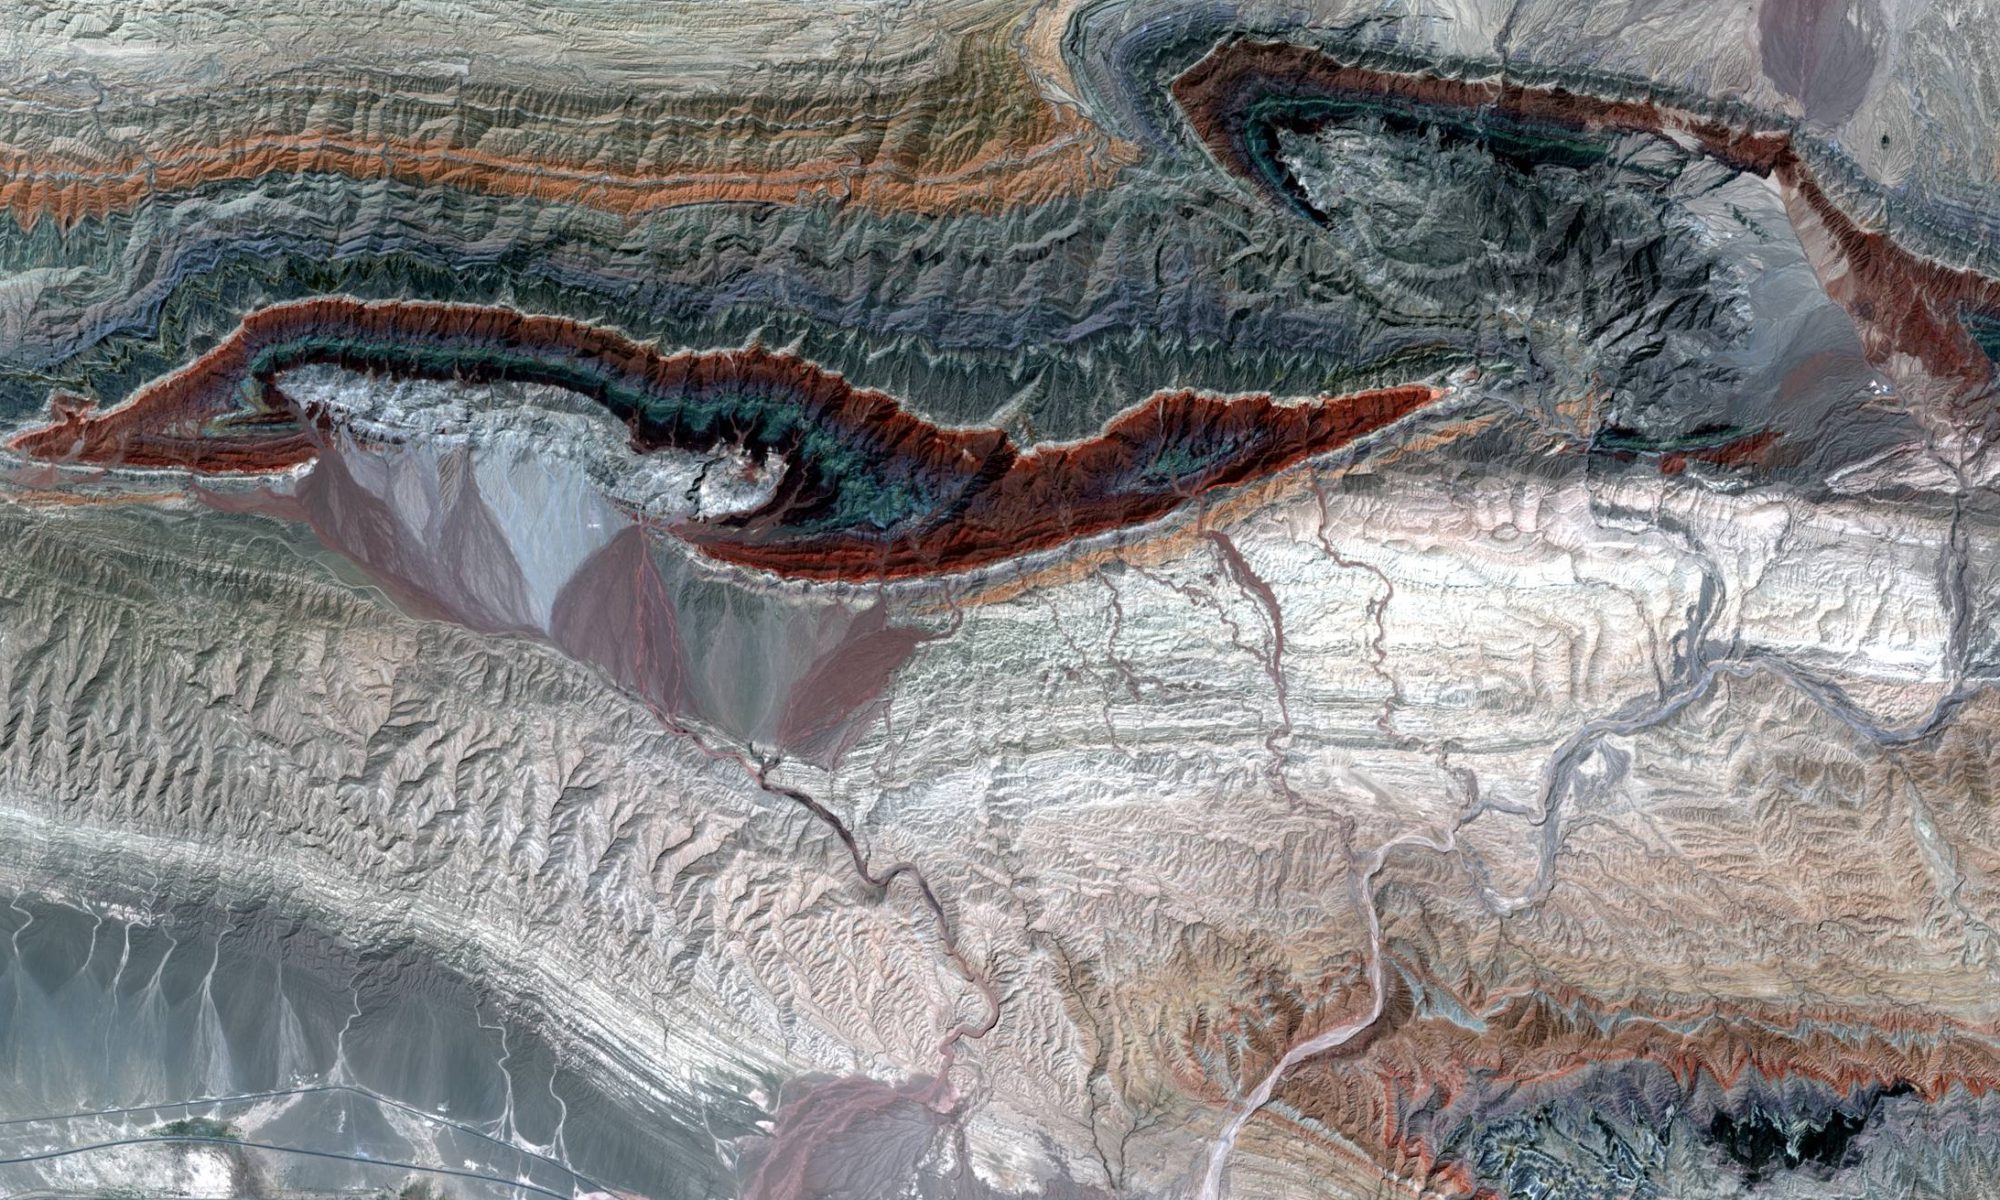
The NE-SW oriented Querococha Arch structure that crosses Antamina shows good examples of several mappable elements, some of which occur in the area around the mine. Individual anticlines, synclines and thrusts terminate, or bend, across the trace of the structure, as a result of changes in the underlying stratigraphic package (figure 7). When zooming out further, it becomes clear that the entire Marañon fold-thrust belt steps to the right around the NE-SW fundamental basement structure (figure 8).
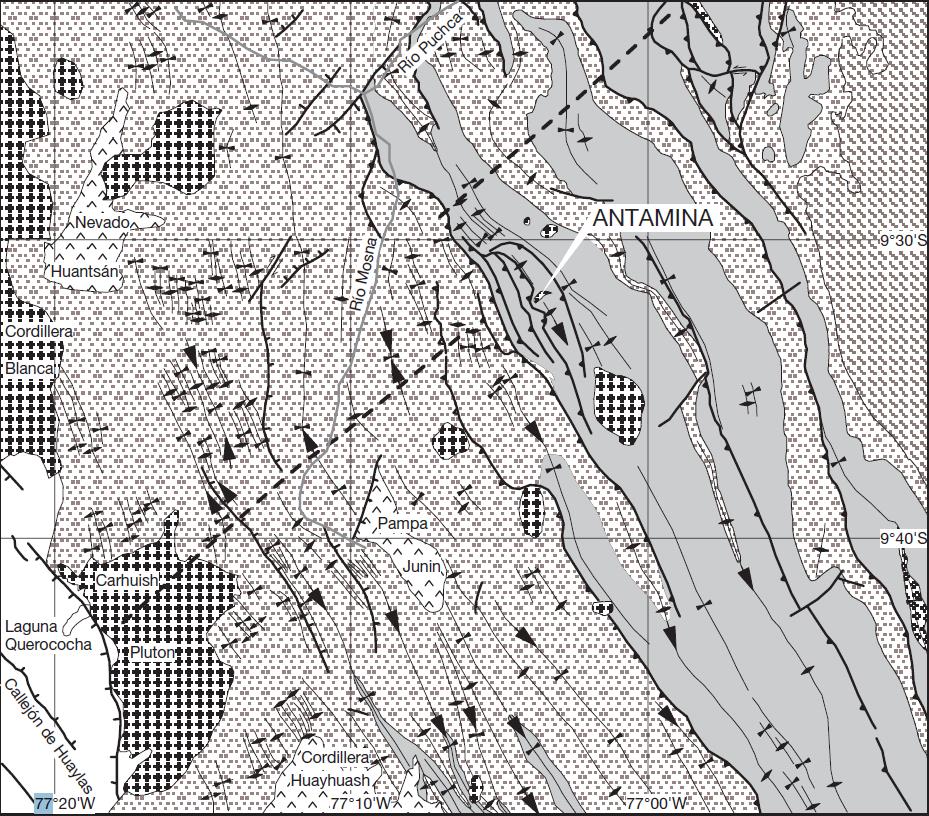
Figure 7: Trace of Querococha Arch, the fundamental basement structure in the area around Antamina. Changes in frequency and orientation of synclines, anticlines and faults change across the structure (Love et al., 2004)
Even more profound than the changes near Antamina are those in the surface geology 200 km to the NE (figure 8). East of the 76°W meridian (black N-S line through purple box in figure 8) the NE-SW fault runs through a river valley that separates two parts of the Sub-Andean Fold-Thrust Belt, each with a distinctly different geometry. On the northern side, the older lithologies (Mesozoic) are exposed in the western part of the uplifted range, while folded Cenozoic sediments crop out along the eastern limit of the up-thrusted block. To the south of the NE-SW valley, the bulk of the up-thrusted Mesozoic lithologies are exposed at surface in the eastern part of the block, while to the west mainly Cenozoic units are found in outcrop. Another clear difference is the presence of a significant west-verging thrust to the north of the fundamental basement structure, while no thrust with that vergence has been mapped to the south. As a result of the difference in resistance against erosion of the various lithologies found at surface, elevation data clearly reflect the changes in deformation geometry, across this vertically accretive basement structure (figure 2).
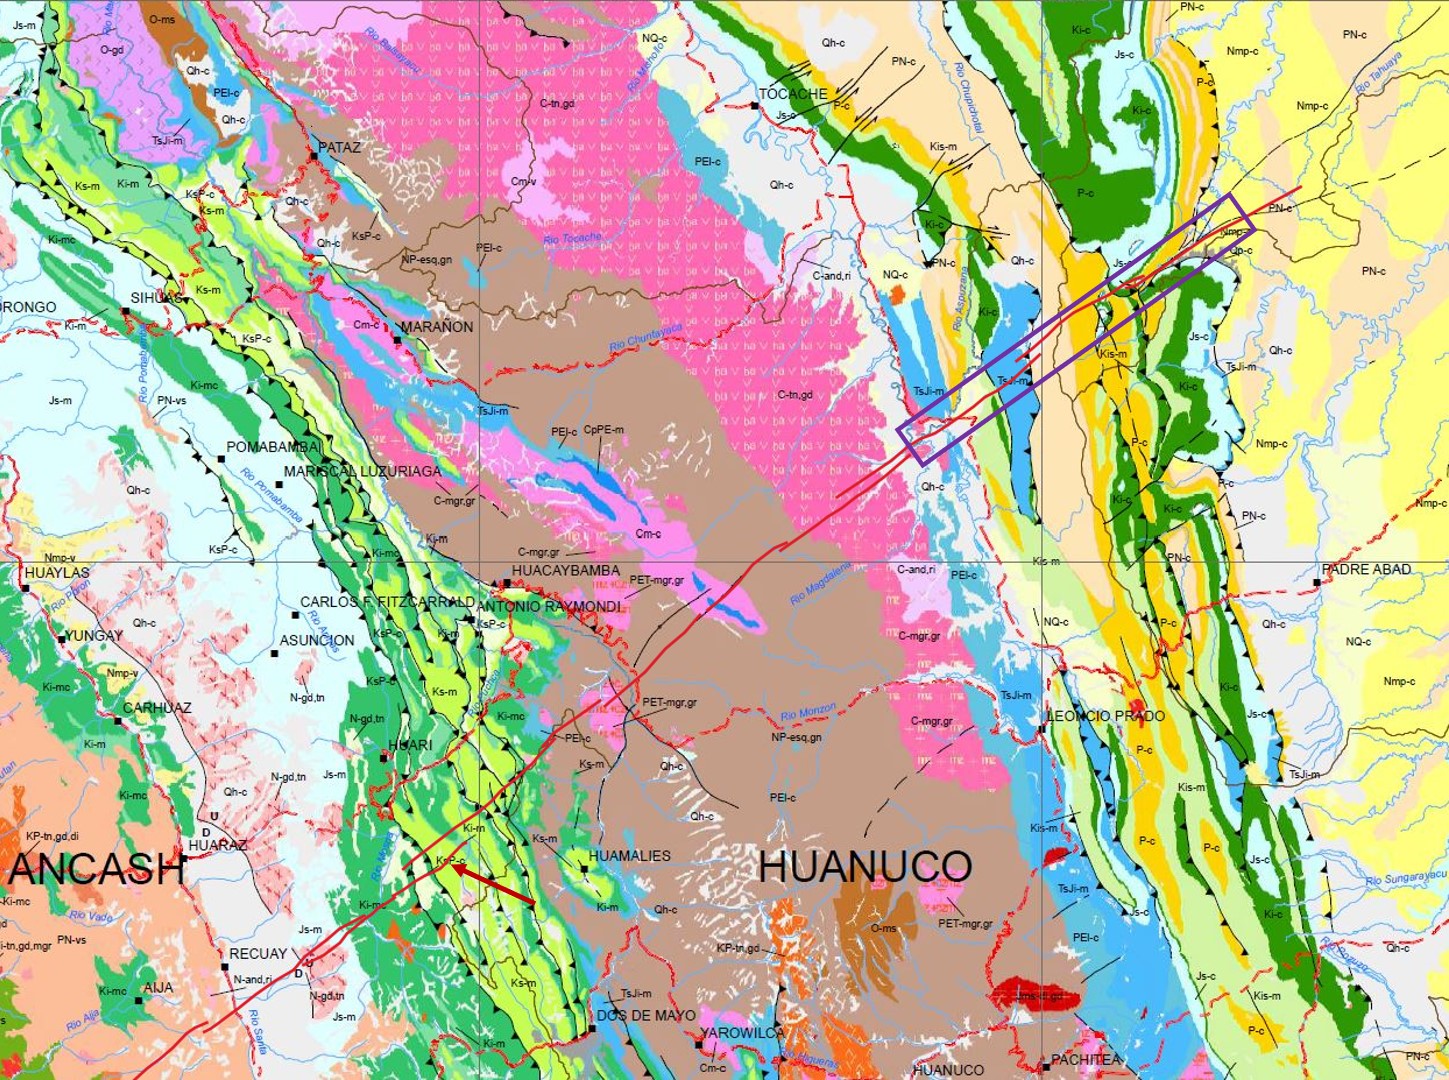
Figure 8: Dark red arrow indicates location of the Antamina mine, in a zone where the (green colored) Marañon Fold-Thrust Belt steps to the right. Purple box in NE indicates same area as blue box in figure 2, where the geometry of the Sub-Andean Fold-Thrust Belt completely changes from N to S, across the NE-SW fundamental basement structure. Excerpt from Geological Map of Peru (scale 1:1.000.000), published by INGEMMET Peru.
Subtle features and datasets
The parts of fundamental basement structures that do not show displacement at surface as significant as the examples shown above (schematically shown in figure 3), commonly form subtle lineaments, which extend for 10s – 100s of kms. These can often be mapped with satellite data too; in some parts they are more evident in the elevation data, while in other areas they are more clearly visible on the imagery, depending on the nature of the subtle deformation of the lithologies at surface. However, it is important to know what to look for, and significant experience in mapping geology with satellite datasets allows for the detection of the subtle surface expression of deep structures that others would be unable to recognize. Geosense has built this expertise through the geological mapping of large regions for exploration projects around the globe.
Nowadays, the resolution of freely available imagery and elevation data is sufficient to map large fundamental basement structures in most geologic settings. Such satellite datasets can be obtained easily, directly from archive, with choice from a variety of imagery options (e.g. Sentinel 2 data – up to 10m resolution, and Landsat and ASTER, both up to 15m) and DEMs -digital elevation models (e.g. SRTM and AW3D30 – both 30m resolution). These datasets provide a uniform, unbiased, global coverage at a higher resolution than any other global datasets, which makes satellite data excellent for use in continental/province scale exploration programs.
Summary
Large ore deposits of many types are commonly found in the vicinity of deep structures. Knowledge about the locations of these structures is relevant during the regional exploration programs. Basement structures are commonly reactivated during the early (extensional) stages of basin development. Subsequent deformation often results in the development of mappable features along the trace of the basement structures, due to changes in the sedimentary columns on either side of the structure.
While fundamental structures extend over large distances, their surface expression tends to be very subtle along parts of their trace. Recognizing and mapping these structures can be a challenge, and one needs a skilled structural geologist with ample, relevant experience in photogeology, who can translate subtle geomorphological changes into valuable structural information. Geosense has this experience, and offers this service to exploration teams working on regional greenfields exploration programs worldwide.
As the data itself is free, the cost of this method is low, when compared to other methods for recognizing fundamental basement structures. This makes it an ideal method during regional generative exploration, to help determine areas where more detailed and more costly exploration methods should be focused.
References
Chernicoff, C.J., Richards, J.P. and Zappettini, E.O., 2002, Crustal lineament control on magmatism and mineralization in northwestern Argentina: geological, geophysical and remote sensing evidence. Ore Geology Reviews 21-3, p. 127-155.
Daly, M.C., Chorowicz, J. and Fairhead, J.D., 1989, Rift basin evolution in Africa: the influence of reactivated steep basement shear zones. In: Cooper, M.A. and Williams, G.D. (eds.), Inversion Tectonics. Geological Society of London, Special Publications 44, p. 309-334.
Garwin, S., Hall, R and Watanabe, Y., 2005, Tectonic Setting, Geology, and Gold and Copper Mineralization in Cenozoic Magmatic Arcs of Southeast Asia and the West Pacific. In: Hedenquist, J., Goldfarb, R. and Thompson, J. (eds.), Economic Geology 100th Anniversary Volume, Society of Economic Geologists, p. 891-930.
Grauch V.J.S., Rodriguez B.D., Bankey V., and Wooden J.L., 2003, Geophysical and isotopic constraints on crustal structure related to mineral trends in north-central Nevada and implications for tectonic history. Economic Geology 98-2, p. 269-286.
Groves, D.I. and Santosh, M., 2015, Province-scale commonalities of some world-class gold deposits: Implications for mineral exploration. Geoscience Frontiers 6-3, p. 389-399.
Hill, K.C., Kendrick, R.D., Crowhurst, P.V. and Gow, P.A., 2002, Copper-gold mineralization in New Guinea: tectonics, lineaments, thermochronology and structure. Australian Journal of Earth Sciences 49-4, p. 737-752.
Love, D.A., Clark, A.H., and Glover, J.K., 2004, The Lithologic, Stratigraphic, and Structural Setting of the Giant Antamina Copper-Zinc Skarn Deposit, Ancash, Peru, Economic Geology 99, p. 887-916.
McCuaig, T.C., Beresford, S.W. and Hronsky, J.M.A., 2010, Translating the mineral systems approach into an effective exploration targeting system. Ore Geology Reviews 38-3, p. 128-138.
McCuaig, T.C. and Hronsky, J.M.A., 2014., The mineral system concept: the key to exploration targeting. Society of Economic Geologists Special Publication 18, p. 152-175.
Mole, D. R., Fiorentini, M. L., Thebaud, N., McCuaig, T. C., Cassidy, K. F., Kirkland, C. L., Wingate, M. T. D., Romano, S. S., Doublier, M. P., Belousova, E. A., 2012, Spatio-temporal constraints on lithospheric development in the southwest-central Yilgarn Craton, Western Australia. Australian Journal of Earth Sciences 59-5, p. 625-656.
Morley, C.K., Haranya, C., Phoosongsee, S., Kornsawan, A. and Wonganan, N., 2004, Activation of rift oblique and rift parallel pre-existing fabrics during extension and their effect on deformation style: examples from the rifts in Thailand. Journal of Structural Geology 26-10, p. 1803-1829.
Richards, J.P., 2003, Tectono-Magmatic Precursors for Porphyry Cu-(Mo-Au) Deposit Formation. Economic Geology 98-8, p. 1515-1533.
Turner, S.A., Cosgrove, J.W. and Liu, J.G., 2010, Controls on lateral structural variability along the Keping Shan Thrust Belt, SW Tien Shan Foreland, China. Geological Society of London, Special Publications 348, p. 71-85.
A previous version of this article has been published on LinkedIn.