Introduction
Reflection seismic is currently the primary geophysical technique in onshore exploration for natural resources, particularly in geological settings where the subsurface is characterized by a flat to moderately dipping ‘layer cake’ stratigraphy. Under the right circumstances, the image of the deep subsurface provided by seismic reflection is both clearer and more detailed than what can be achieved with other geophysical methods. Yet there are still significant challenges during acquisition, processing and interpretation of land seismic data, which influence the quality of both data and interpretations.
To help improve the understanding of the subsurface, Remote Sensing data (RS data) can provide information that is useful at different stages of the lifecycle of land seismic reflection data:
- Determine the lithologies at surface, steepness of slopes and roughness of the terrain during the planning phase for the acquisition of land seismic surveys.
- Improve the characterisation of the heterogeneous near-surface layer, as well as help construct velocity models that make sense geologically, for the processing of seismic reflection data.
- Increase geological understanding during interpretation in areas only covered by sparse 2D seismic lines, or poor-quality seismic data. Connect structures detected in individual seismic lines with each other along the surface. Use the orientations and thicknesses of stratigraphic units at surface to build cross-sections and model geological structures into the subsurface.
The focus of this article is on geological mapping of RS data to provide an accurate characterization of the near-surface layer, and use this information for the (re)processing of seismic reflection data.
Geographical information
As figure 1 shows, the acquisition of a land seismic survey leaves marks behind at the surface, which are visible from space. The image shows part of Egypt’s Western Desert, where a seismic survey was acquired along a grid of N-S and E-W oriented lines. If, at the beginning of a reprocessing project, uncertainty exists about the geographical details of the survey, RS data can help determine this information. As long as the acquisition dates are known, the exact location of seismic lines and the approximate elevation values of shots and receivers can be extracted. Archives of satellite data go back to the 1970s, and archives of aerial photos go back even further.

Figure 1: Western Desert – Egypt – showing the N-S and E-W oriented lines of a grid left behind by a seismic survey. (Data: Sentinel-2)
Variations in the Near-Surface
Besides the acquisition grid, the image of the Western Desert also shows significant variations in the surface geology (figure 1). The same tectonic activity that leads to the formation of petroleum systems, causes the near-surface to be made up of a variety of different lithologies and geomorphological landforms. In most onshore regions, the surface geology is characterized by a combination of erosional areas, with relatively old, hard rocks in outcrop, and sedimentary areas, where relatively young, unconsolidated sediments cover the older, underlying strata (figure 2). The transitions between these areas can either be sharp boundaries (for example a fault that juxtaposes old rocks against unconsolidated sediments) or gradual shifts (e.g. an alluvial fan with conglomerates and gravels near steep slopes, shifting into finer grained deposits in the distal parts).
Other factors, such as intensity of weathering, differential compaction of recent sediments and the depth of the water column, further impact the complexity of the near-surface. This complexity is reflected in steep gradients in the physical properties of the shallow subsurface, both vertically and laterally. These properties include density and elastic properties, which largely determine seismic velocities. Thus, the high level of complexity of the near-surface geology causes significant lateral and vertical variations in seismic velocities, and affects the propagation of seismic waves. It is therefore important to have accurate information about this heterogeneous part of the rock column, during seismic processing.
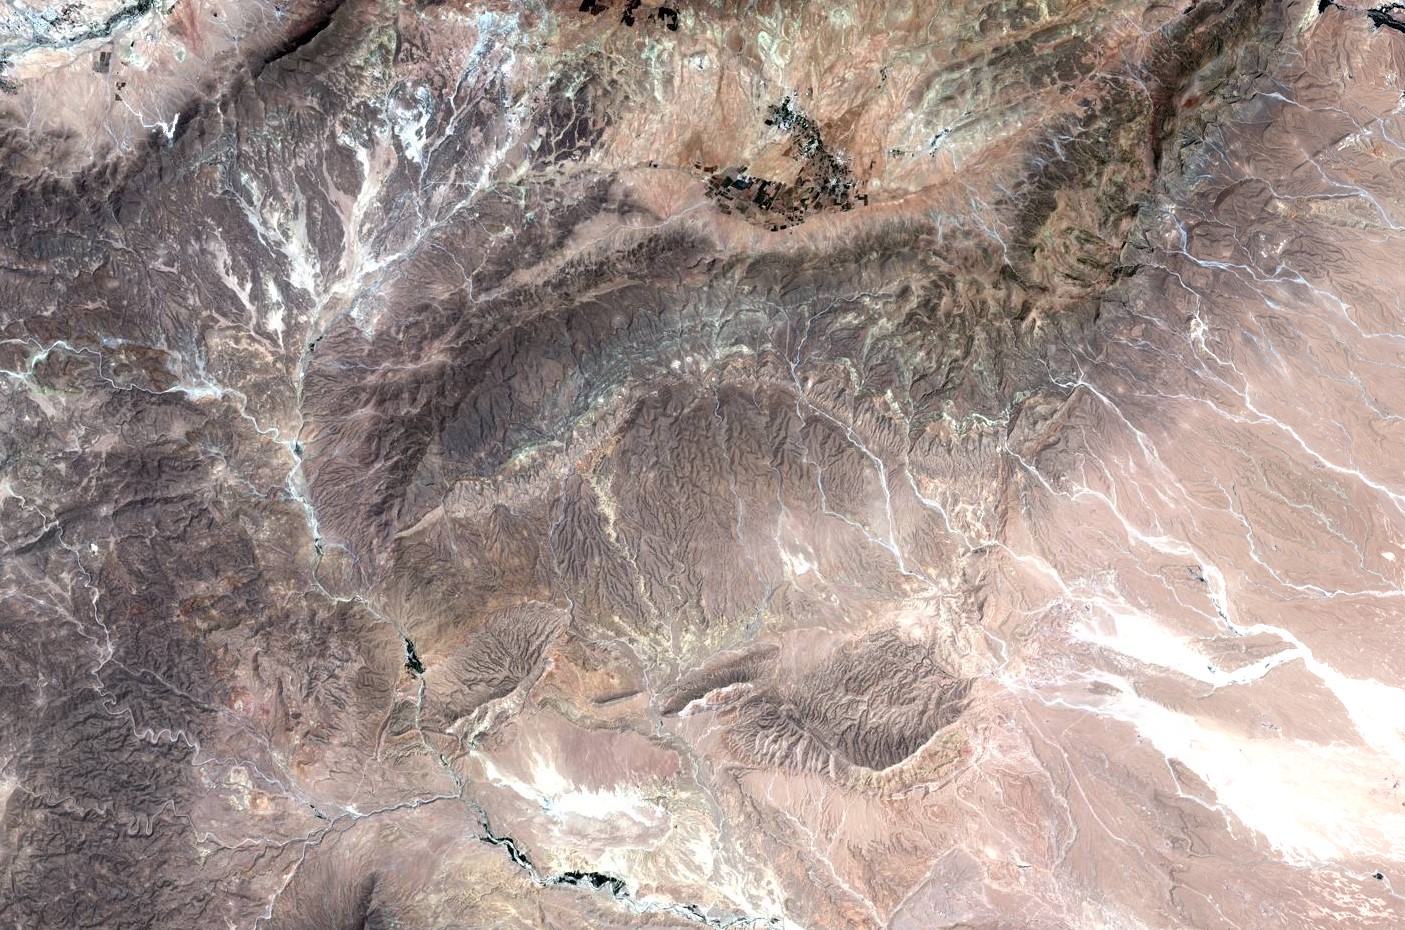
Figure 2: Middle Atlas – Morocco – Natural colour image showing relatively old, hard rocks in (weathered) outcrop in the north and west, and sedimentary areas in the south and east, where relatively young, unconsolidated sediments cover the older strata. (Data: Sentinel-2, bands 4, 3 & 2 as RGB)
The near-surface geology is sometimes referred to as the ‘weathered layer’ by geophysicists, even though it doesn’t necessarily coincide with the depth of geological weathering. While poor knowledge of the shallow geology is detrimental to seismic imaging of the geology at depth, current practices for understanding near-surface anomalies are generally limited to extracting information from seismic methods. These methods include shallow seismic refraction methods (such as first arrival tomography – Zhu et al., 1999), uphole velocity measurements, surface wave inversions and measurements of the stiffness and viscosity of the ground (figure 5 – Ley et al., 2006). These methods provide useful information, but they have their limitations: all are based on seismic waves, or data from the acquisition itself, and the maximum number of datapoints is limited to shot and receiver points along the lines of the seismic grid, with no datapoints in between. It would be logical to complement these methods with other techniques suitable for the detection of variations in the near-surface, which are based on external sources of information, and integrate them into the seismic processing workflow.
One such technique is mapping the geology and geomorphology of the survey area with RS data. This works well because, besides seismic velocities, the lateral changes in lithologies in the near-surface are reflected in other physical properties as well. The terrain reflects some of these properties, which makes it possible to distinguish them in RS data (figure 2), both in elevation data and in imagery. Several examples of how the terrain reflects certain physical properties and their variations, and how these can be mapped with RS data:
- Lithologies that are resistant against erosion form topographic highs, while less resistant lithologies and faults tend to form depressions in the topography. Their distribution is visible in a Digital Elevation Model (DEM – figure 4). The resistance against erosion of individual lithologies is roughly correlated with their elastic properties, which makes this information relevant for seismic processing.
- If not covered by vegetation, any changes in the composition of the rocks at surface results in a different reflectance spectrum from incident sunlight, as different lithologies absorb and reflect different parts of the electromagnetic spectrum. This includes parts of the spectrum outside the visible light wavelengths that our eyes are able to see, which is reflected in larger contrast between lithologies when ‘false colour’ images are used for mapping (compare figures 2 & 3). In more vegetated terrain, the vegetation type and thickness often indicate changes in underlying lithologies.
- Changes in permeability and weathering mechanism (mechanical/chemical) are reflected in the drainage pattern, as the behaviour of water partly depends on the lithology at surface. Limestones and evaporites dissolve in water, and weather chemically, while siliciclastic materials mainly weather mechanically, by falling apart into ever smaller pieces, upon exposure at surface. These changes are reflected in drainage patterns, which makes them visible in both imagery and elevation data (figure 4).
- RS data shows whether discontinuities in the near-surface are sharp or gradual, and helps determine the orientation of faults. Faults offset stratigraphic layers and the physical properties of stratigraphic units change in fault zones. The offset layers and the changes in resistance against erosion along fault zones are often visible on RS data (elevation data and/or imagery). This information, in combination with the distribution of lithologies, helps to understand the type of boundary between different lithologies in the near-surface, as well as their orientation.
- Elevation data enables the measurement of bedding dips of stratigraphic layers at surface. Depending on the geological setting, this information, can be extrapolated into the subsurface and help determine the thickness of stratigraphic units and the depth of lithological changes in the subsurface.
- In depositional areas, recent, unconsolidated sediments form fairly flat areas, topographically lower than the older, surrounding rocks. Subtle changes in the type of sediment makes them visible on a DEM and on imagery (figure 2 & 3).
- In those locations where the lithology of the unconsolidated layer is roughly the same, but its thickness changes related to buried structures (faults, folds), differential compaction will leave marks at the surface. These marks include minor elevation changes, which can be reflected in the DEM and in the drainage pattern.
Geologists with significant experience in geological mapping with RS data are able to map these changes and recognize other subtle features that reflect geological changes in the near-surface. The advantages of integrating the mapping of the near-surface with RS data into the seismic processing workflow are numerous:
- It is inexpensive; geological mapping can be done with free, good quality RS datasets that cover the entire land surface of the globe.
- It provides detail; free RS data has a resolution of 10 x 10 m per pixel for imagery and 30 x 30 m for elevation data. If higher resolution data is needed, it is available for a fraction of the cost of a land seismic survey, or the (re)processing of a (historic) seismic dataset.
- It is quick: free data is directly available from archive; higher resolution datasets can normally be provided in days/weeks. The interpretation of the near-surface will only take a number of weeks, compared to months for big, complex (re)processing projects of 3D seismic datasets.
- Data is contiguous and provides continuous coverage, including in the gaps between the lines of shots and receivers. Therefore, RS datasets are able to provide more datapoints for the near-surface, and more detail on the distribution of different lithologies at surface, than the methods that are currently used.
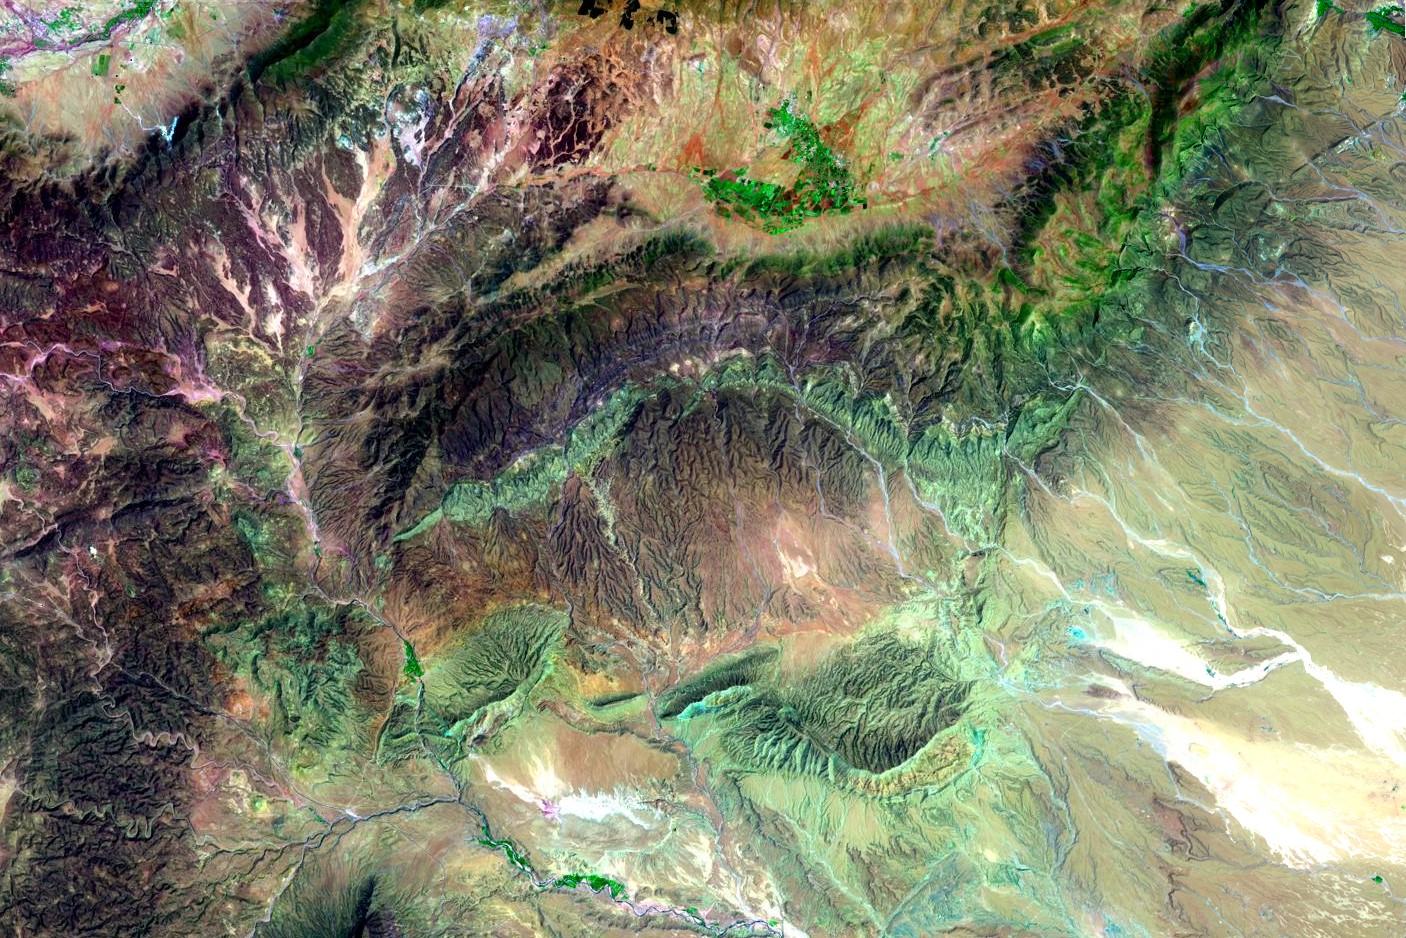
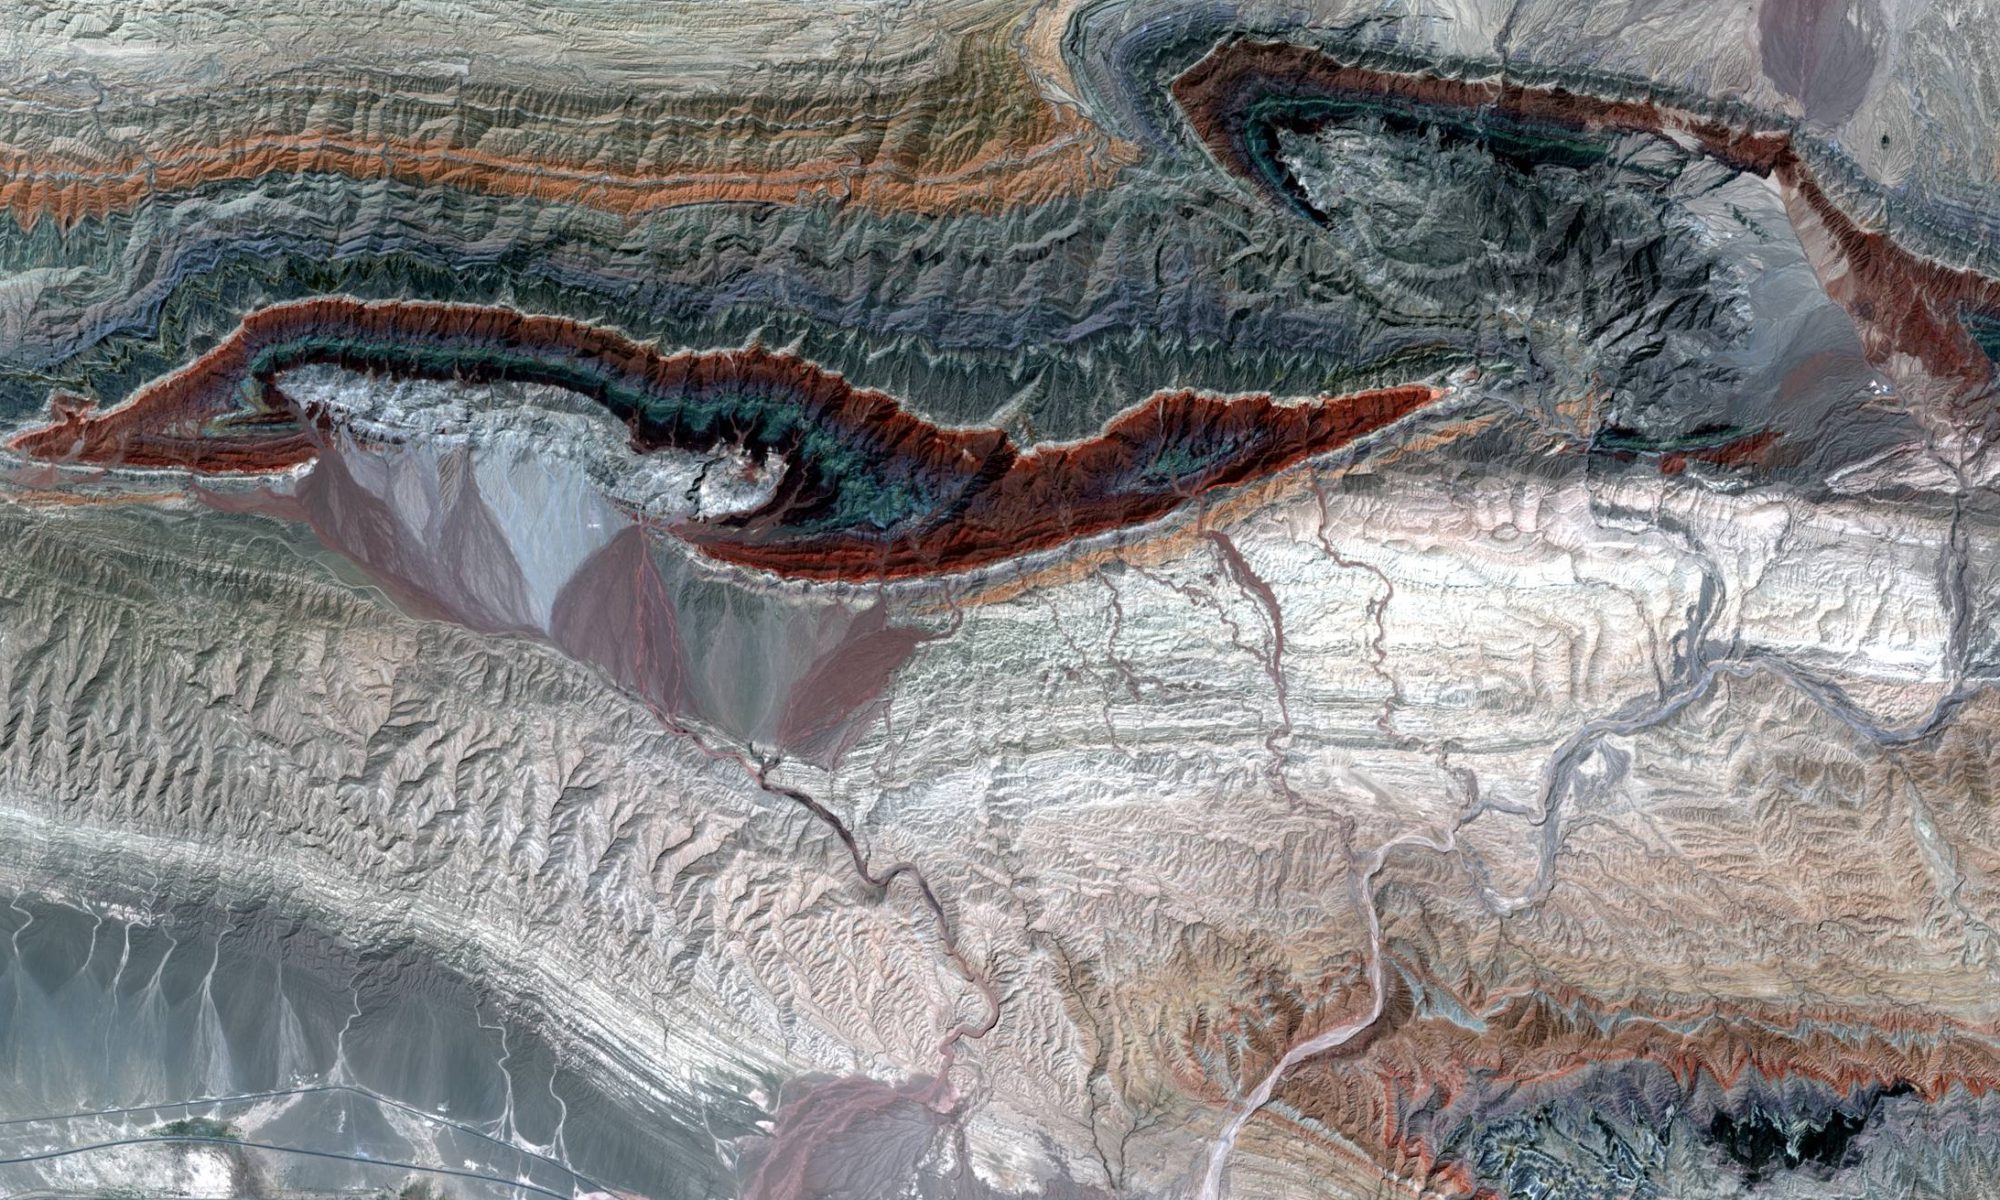
Figure 3: False colour image over same area as figure 2. Visualization of bands outside the visible spectrum helps distinguish different lithological units, as well as subtle changes in composition in recent unconsolidated sediments. (Data: Sentinel-2, bands 12, 8 & 2 as RGB)
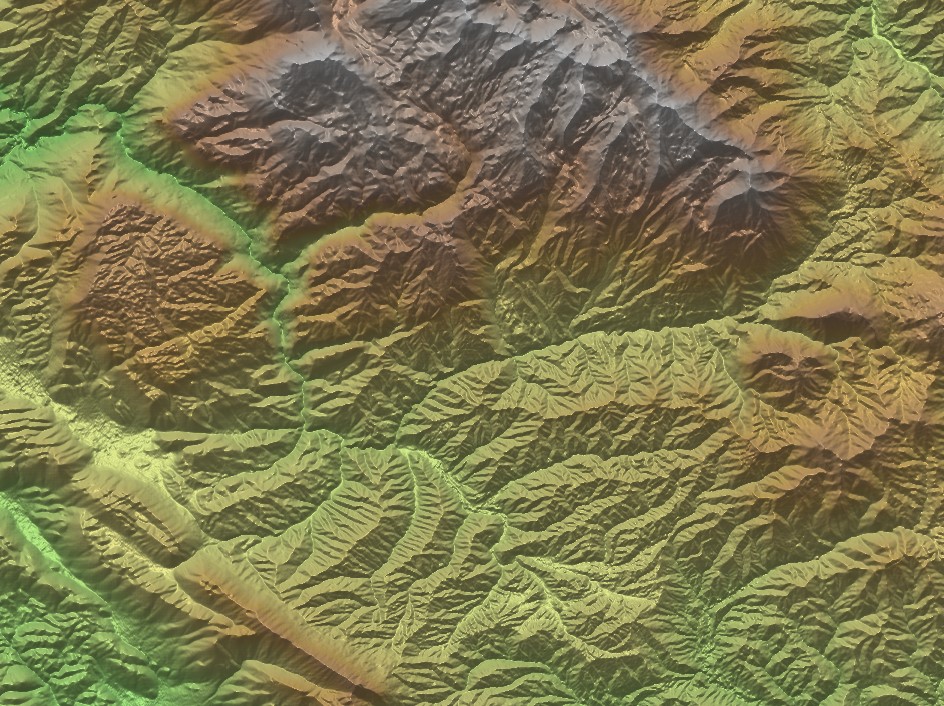
Figure 4: DEM of part of western Greece, showing differences in resistance against erosion of different lithologies throughout the area. The plateau in the central part of the northern half shows the typical morphology that results from the chemical weathering of massive limestones: rugged terrain, characterized by high altitudes in comparison with surroundings, steep slopes and relatively few river valleys. The area to the south shows the typical drainage pattern for more erosion resistant siliciclastic lithologies: lower altitudes, more gradual slope angles, and well-developed drainage patterns with many small streams in multiple directions, draining into bigger rivers. (Data: AW3D30)
Advantages during processing
An accurate interpretation of variations in the surface geology and terrain characteristics before starting the processing of seismic data allows for a better understanding of the seismic records, and their quality throughout the surveyed area, during the processing. Recognizing variations in the near-surface makes it possible to correct for the distortions caused by lateral and vertical gradients in seismic velocities in this shallow part of the rock column. This has a whole range of benefits during processing, including the following:
- More accurate analysis of surface (Rayleigh) waves, or ‘ground roll’, and changes in the velocities of these waves, throughout the survey area. Ground roll is often considered one of the main sources of noise in land seismic datasets. An accurate understanding of the distribution of velocity anomalies throughout the surveyed area helps distinguish between signal and noise in the seismic records.
- Statics corrections become more consistent with the near-surface variations, because of a better understanding of the variations in this relatively low velocity part of the shallow subsurface. Static corrections mainly make up for two aspects of the data; first the elevation of seismic sources and receivers, and second the often anomalously low and highly variable seismic velocities of the near-surface layer (Cox, 1999). Having accurate information on the distribution of different lithologies and faults in the near-surface, and indications of the thickness of unconsolidated sediments, helps with the determination of appropriate statics throughout the survey area.
- Near-surface variations are a possible source of residual amplitude variations, after despiking. The surface geology helps to understand the distribution of anomalies in the residual amplitudes for shot points and receivers.
- Understand the causes of variations in first breaks, as they correlate with the distribution of the different near-surface units that were distinguished during the surface geological mapping.
- Clear comprehension of the coupling with the ground of both sources and receivers; lithologies and ground conditions have a significant influence on the strength of the seismic signal, and can vary significantly over short distances. These variations are reflected in changes in ground viscosity and stiffness values that can be gathered during the acquisition, and in the ratio between them (Ley et al., 2006, figure 5).
- Rapid detection of the above ground causes of amplitude anomalies. More on this in a later paragraph.
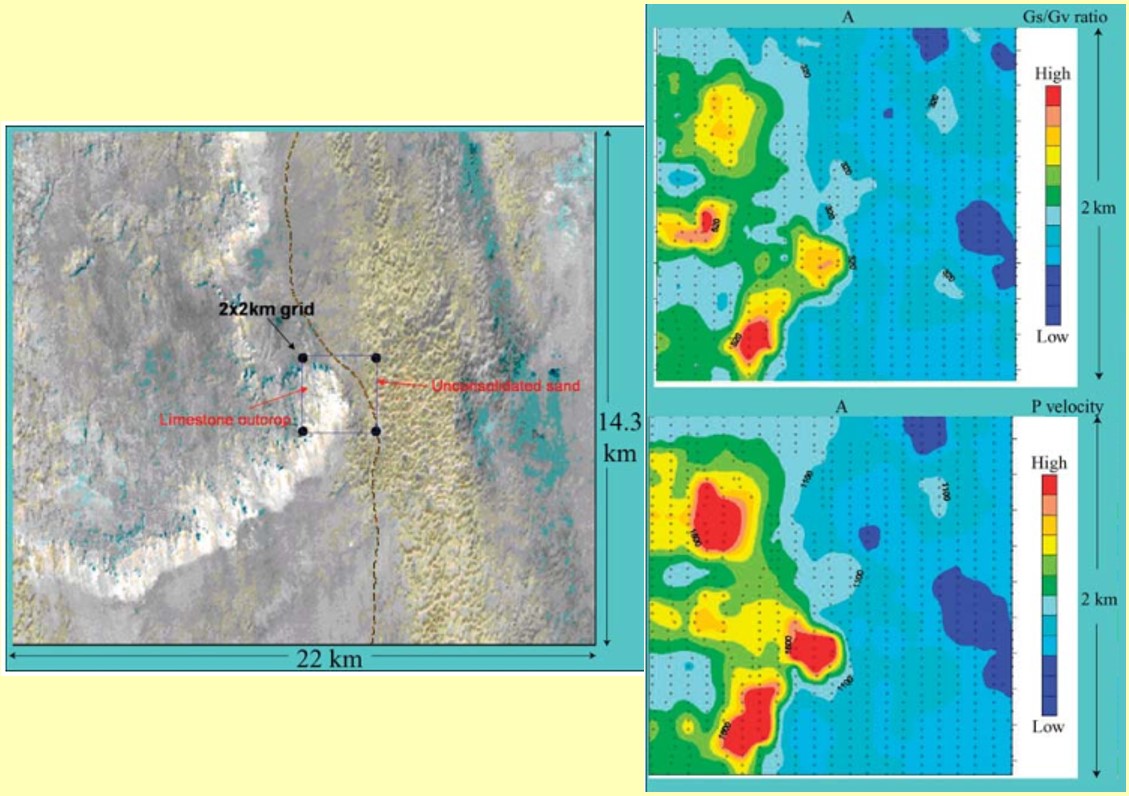
Figure 5: Images from Ley et al., 2006, showing ground stiffness/viscosity ratio, from data recorded by a vibroseis control system, and P-wave velocity over a 2 x 2 km area in Saudi Arabia. The surface geology is characterized by outcropping limestones (Jebel) in the W, and unconsolidated sand (dunes) overlying flat sabkha deposits in the E
While the use of RS datasets to increase understanding of the near-surface is useful across different climates, this methodology is particularly beneficial in dry, arid areas (e.g. Middle East, North Africa, Neuquén Basin in Argentina). In such non-vegetated regions, low water content in the near-surface reduces the strength of the seismic signal. Yet due the lack of vegetation the surface geology is very well exposed and visible on RS data (figure 3), which makes it easier to accurately characterize the near-surface. A further effect of the absence of vegetation is the lack of soil development, which increases the presence of hard ground at the surface, and with it the likelihood of surface-related noise and multiples, when compared with soft ground in vegetated areas where soil has developed (Vestrum & Gittins, 2015). In humid regions a similar effect occurs where massive limestones are exposed at surface and soil development happens much slower than over most siliciclastic lithologies (figure 6). Combine this with the detrimental effect of karstification on seismic data and it becomes clear why it is so hard to acquire good quality seismic data in PNG and parts of Indonesia, and other parts of the world with significant amounts of limestones at surface.
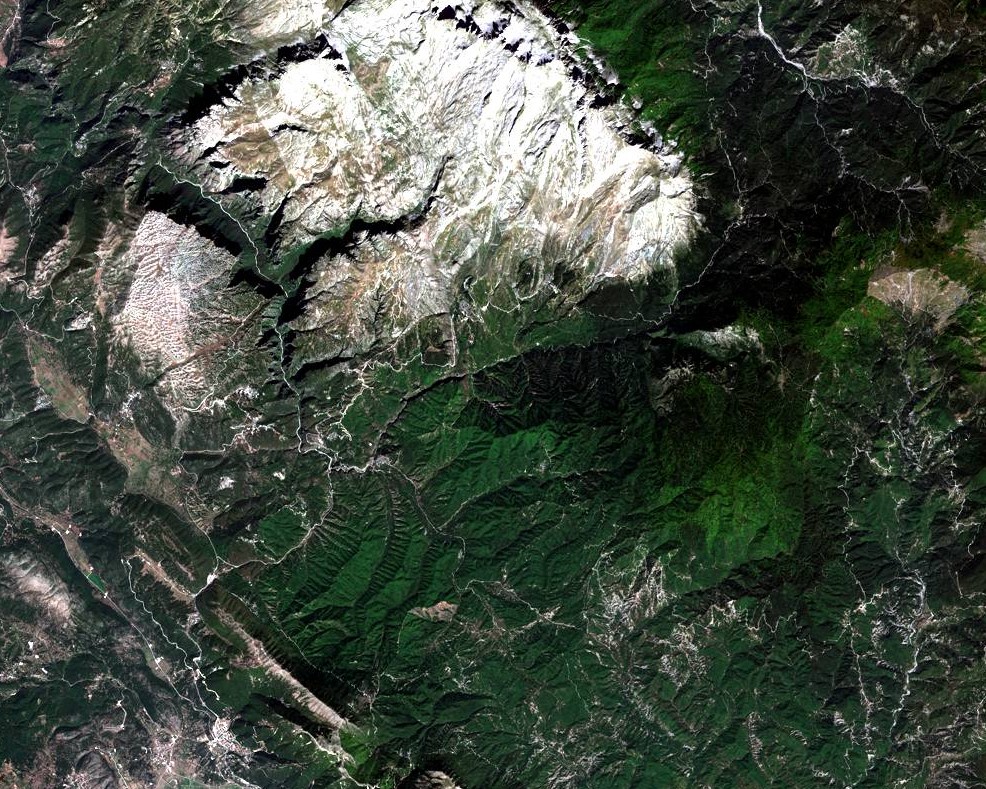
Figure 6: Western Greece – natural colour imagery over the same area as figure 4. Clear difference in soil development and vegetation density between the limestone plateau in the north, and the areas of siliciclastic rocks south of it. (Data: Sentinel-2, bands 4, 3 & 2 as RGB)
Above ground effects to seismic signal
Besides the previously described causes of anomalies in seismic amplitudes below the surface, there are above ground reasons for noise as well (figure 7). Many sources of noise are the result of human activities, such as the presence of roads, pipelines, powerlines and other infrastructure, or activities that increase the water content in the near-surface in otherwise dry areas, such as irrigation (figure 8). The visibility of these features on satellite imagery enables a quick understanding of localized noise and amplitude changes in the unprocessed data. Early detection of sources of seismic noise is beneficial during processing projects, and another good reason to use information derived from satellite data throughout the processing workflow of land seismic data.
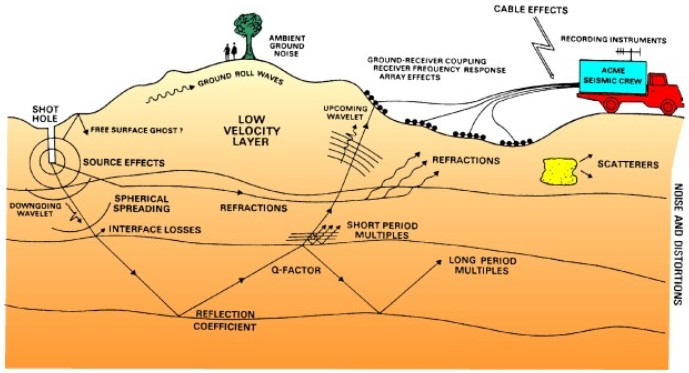
Figure 7: Processes altering seismic amplitudes, many of which originate in the near-surface, or above the ground. From: Reynolds, 1998 – courtesy of BP
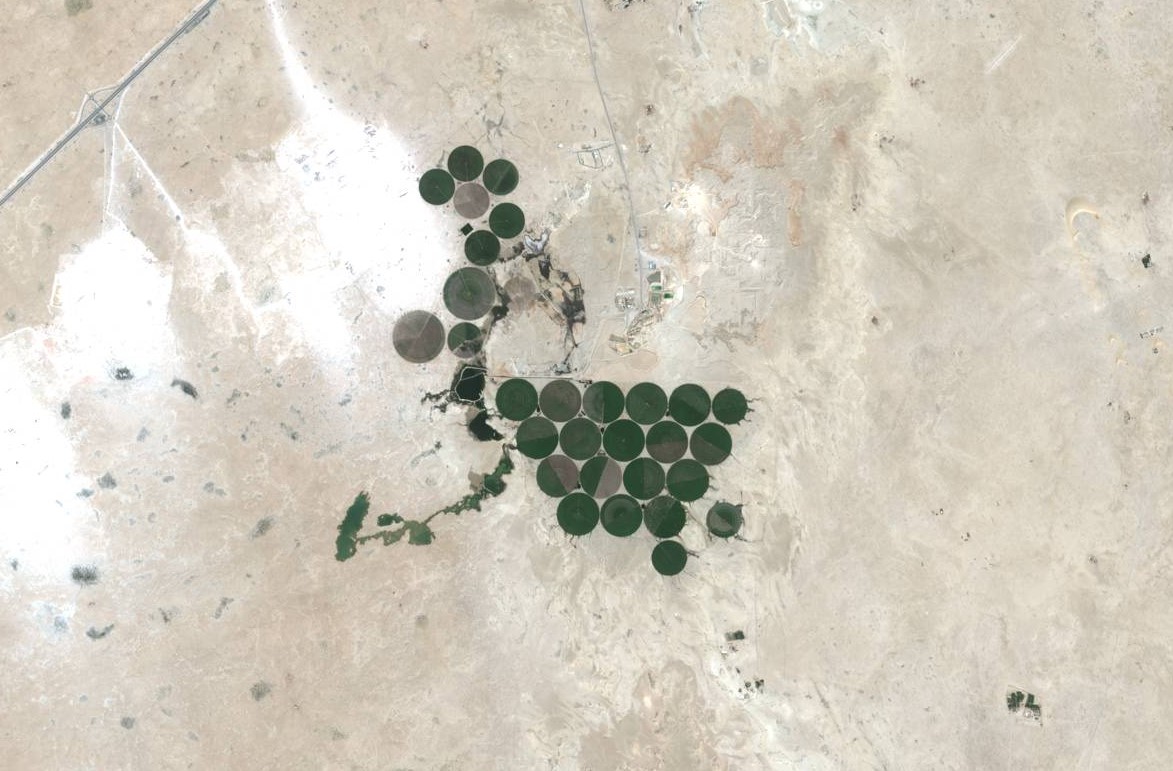
Figure 8: Central Qatar – Natural colour image showing typical round irrigated agricultural fields, common in dry regions around the world. Increased moisture in the near-surface as a result of irrigation leads to anomalously high seismic velocities below these fields, which results in pull-ups in the reflectors. (Data: Sentinel-2, bands 4, 3 & 2 as RGB)
Summary
Geological mapping with RS data for the processing of land seismic data leads to a better understanding of variations in the heterogeneous near-surface. The changes in physical properties that affect seismic velocities in the near-surface are often reflected in the terrain, and can therefore be mapped accurately by geologists that are experienced in working with RS data. Other information provided by the same datasets helps to quickly recognize above ground sources of noise. Incorporating this information into the seismic processing workflow will result in improved seismic data and a clearer image of the subsurface, which enables more accurate interpretations of the geological setting at depth. While useful in any climate, this is particularly beneficial in dry terrain, where the geology is much more exposed at surface, and the lack of soil development is detrimental to the seismic signal. A similar effect occurs over areas of massive limestone outcrops in vegetated terrain.
During onshore O&G exploration, some of the biggest expenses of the work program include the acquisition, processing and interpretation of seismic data. The current environment of constrained exploration capital is a good moment to look at alternative, inexpensive ways of improving the quality of seismic data, both during the processing of new, and the reprocessing of legacy seismic data. The method explained in this article will quickly help improve seismic data quality for a fraction of the cost of a typical (re)processing project, and seems like an obvious step forward.
A future article will focus on the use of geological mapping with RS data for seismic processing and interpretations specifically in fold and thrust belts.
References
Cox, M., 1999, Static Corrections for Seismic Reflection Surveys. Society Exploration Geophysicists
Ley, R., Adolfs, W., Bridle, R., Al-Homaili, M., Vesnaver, A. & Ras, P., 2006, Ground viscosity and stiffness measurements for near surface seismic velocity. Geophysical Prospecting 54, p. 751-762
Reynolds, J.M., 1998, An introduction to applied and environmental geophysics. Wiley
Vestrum, R.W. & Gittins, J.M., 2015, From Andes to Zagros – Variations in Structural Styles and Seismic Data from Two Processors’ Perspectives. 77th EAGE Conference and Exhibition – Workshops, p. 141 – 144
Zhu, T., Cheadle, S., Petrella, A. & Gray, S. 1999, First-arrival tomography: method and application. SEG Technical Program extended abstracts 2000, p. 2028-2031
This article has also been published on LinkedIn.