Introduction
To understand the geological setting and tectonic history of a region, it is important to start with observations, spread out over the area of interest. Dip directions of sedimentary layers (and layered volcanic rocks) are amongst the most important observations for understanding the geology of an area, together with the structures (faults, folds, foliation, unconformities, etc.) that help understand how the stratigraphic units have been deformed. Measurements of the orientations of layered rocks are generally taken by field geologists, with a geological compass. There are two problems with this method: fieldwork is generally time-consuming and costly, and the access that is required to take such measurements is in many occasions limited, or risky. Fortunately, there are alternative, complementary ways to obtain reliable and accurate information on the orientations of sedimentary layers, using remote sensing data. The continuously increasing quality and resolution of available Digital Elevation Models (DEM) and imagery allows geologists to calculate many, accurate strike and dip measurements, covering large regions quickly.
Benefits
These are the advantages of using this method over, or together with, measuring dip direction in the field:
- It facilitates the quick measurement of many accurate dips over a large region.
- A remote method, useful during the preparation of fieldwork in areas of difficult access or a short field season (arctic areas, thick jungle regions with limited infrastructure, areas with heavy rain during parts of the year, areas with significant safety risks, mapping before permits are received, etc.). In such areas good preparation is vital, to make sure that the limited time in the field is spent in the right locations.
- Determination of bedding dip in locations that are hard to reach due to rugged terrain and steep slopes.
- Increasing number of structural observations in areas where data is scarce. If the resistance against erosion changes throughout the stratigraphic column and these changes are reflected in the topography, it is even possible to determine dips of units that do not appear in outcrop,
- Measure dip direction at a sufficiently large scale that local distortions (caused by cross-bedding, near-surface movements due to ongoing erosion, etc.) do not affect the accuracy of the measurements.
- Quick determination of the location of fold hinges, and the geometry of folds, important for natural resource exploration (anticlines for hydrocarbon accumulations and numerous mineral deposits, synclines for groundwater aquifers).
- Improved understanding of the subsurface, as the surface geology reflects the geometry of the geological setting in the subsurface. Combining dips measurements with the determination of layer thicknesses provides useful inputs into cross sections and 3D geological models.
- More measurements, earlier on in the work program, to help understand the geological setting and tectonic history.
Methodology
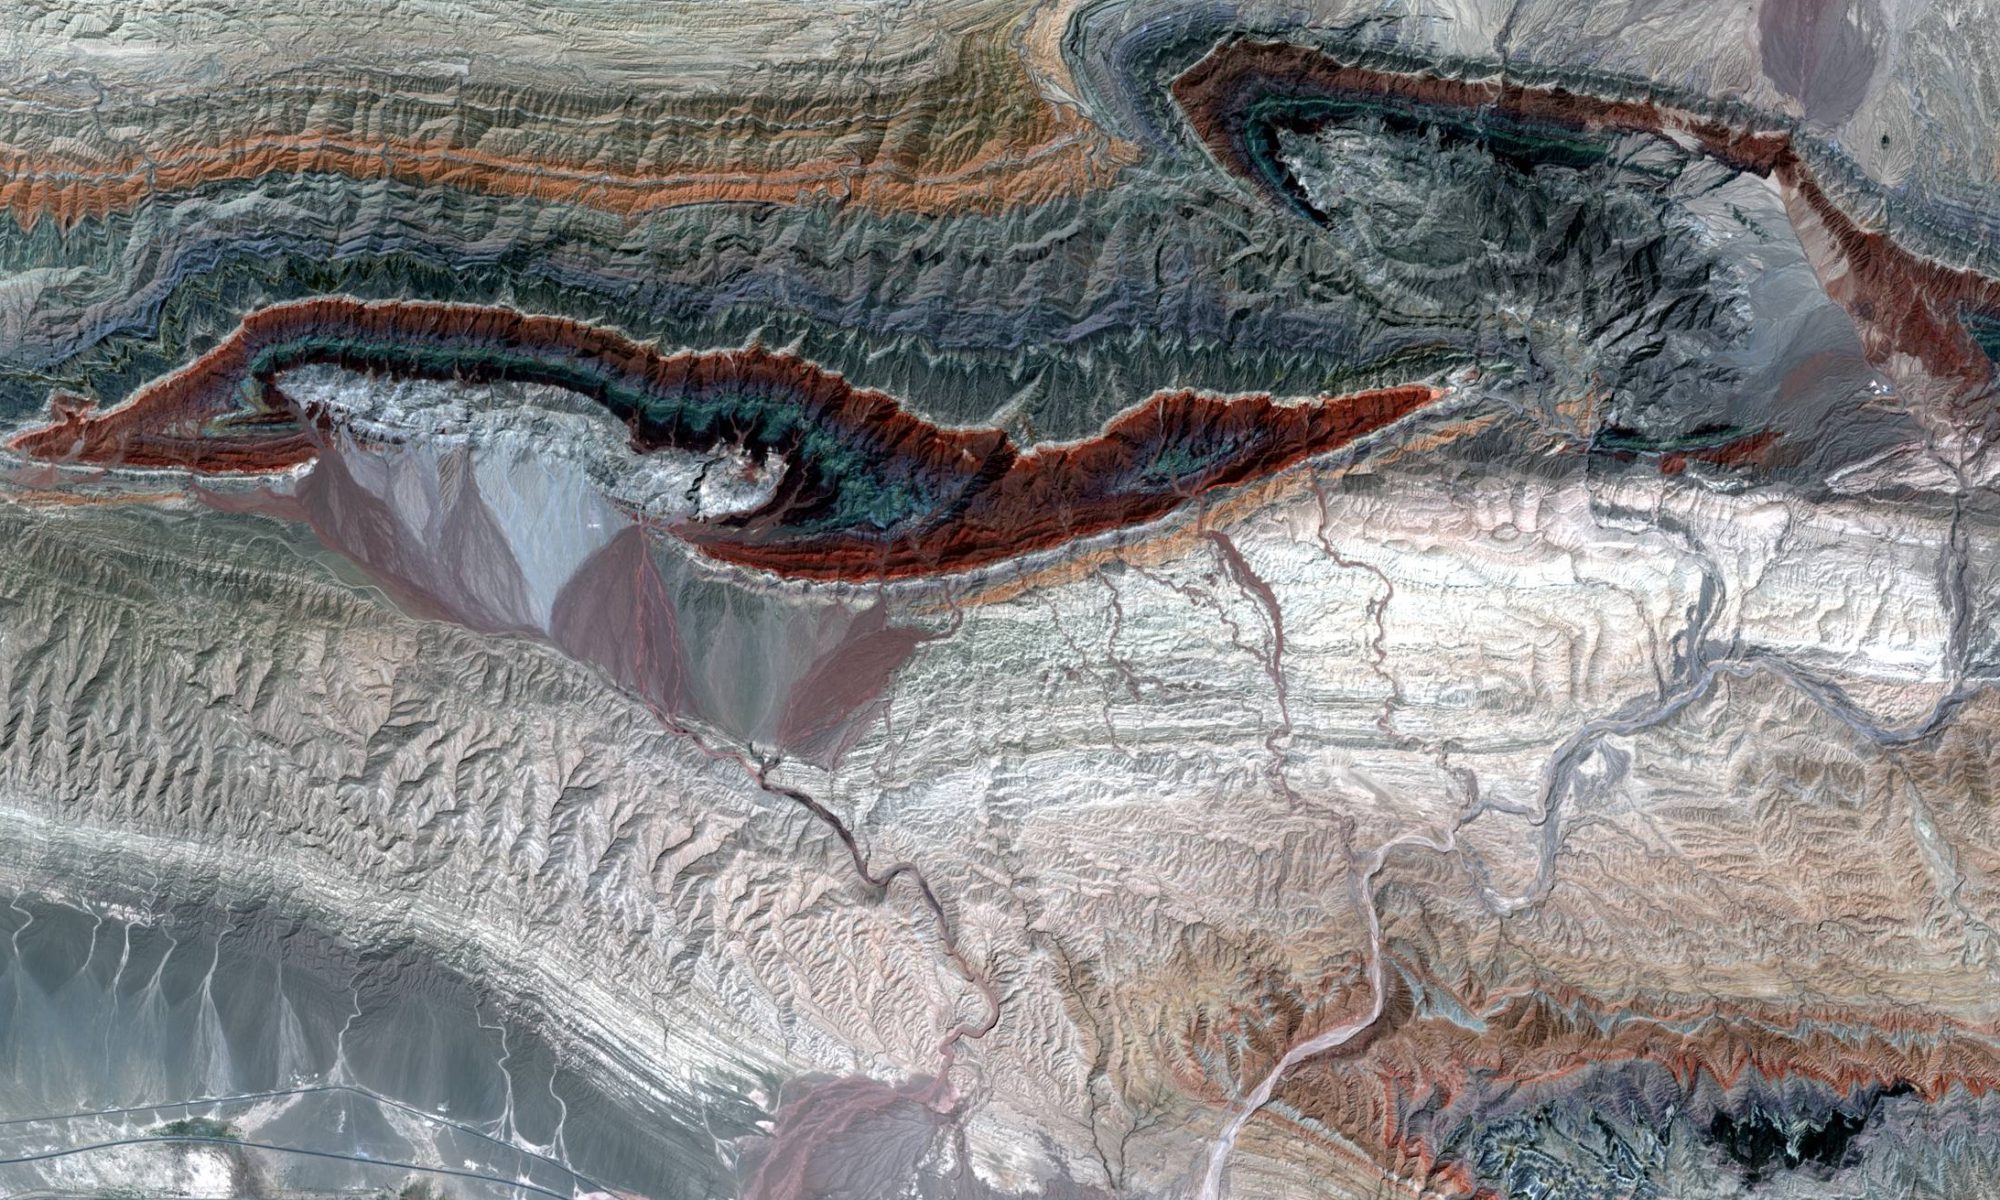
The accurate measurement of the dip direction of stratigraphic layers from elevation data relies on the recognition and accurate calculation of the orientation of stratigraphic layering in remote sensing datasets. Textbook examples of bedding dips that can be measured are flatirons; erosion-resistant layers limited by valleys on either side, forming a triangular shape that stands out in the terrain (figure 1). Geologists with significant experience in using remote sensing data for geological mapping are able to recognize layers that have a much smaller surface expression, and measure strike and dip from much subtler features in the terrain.
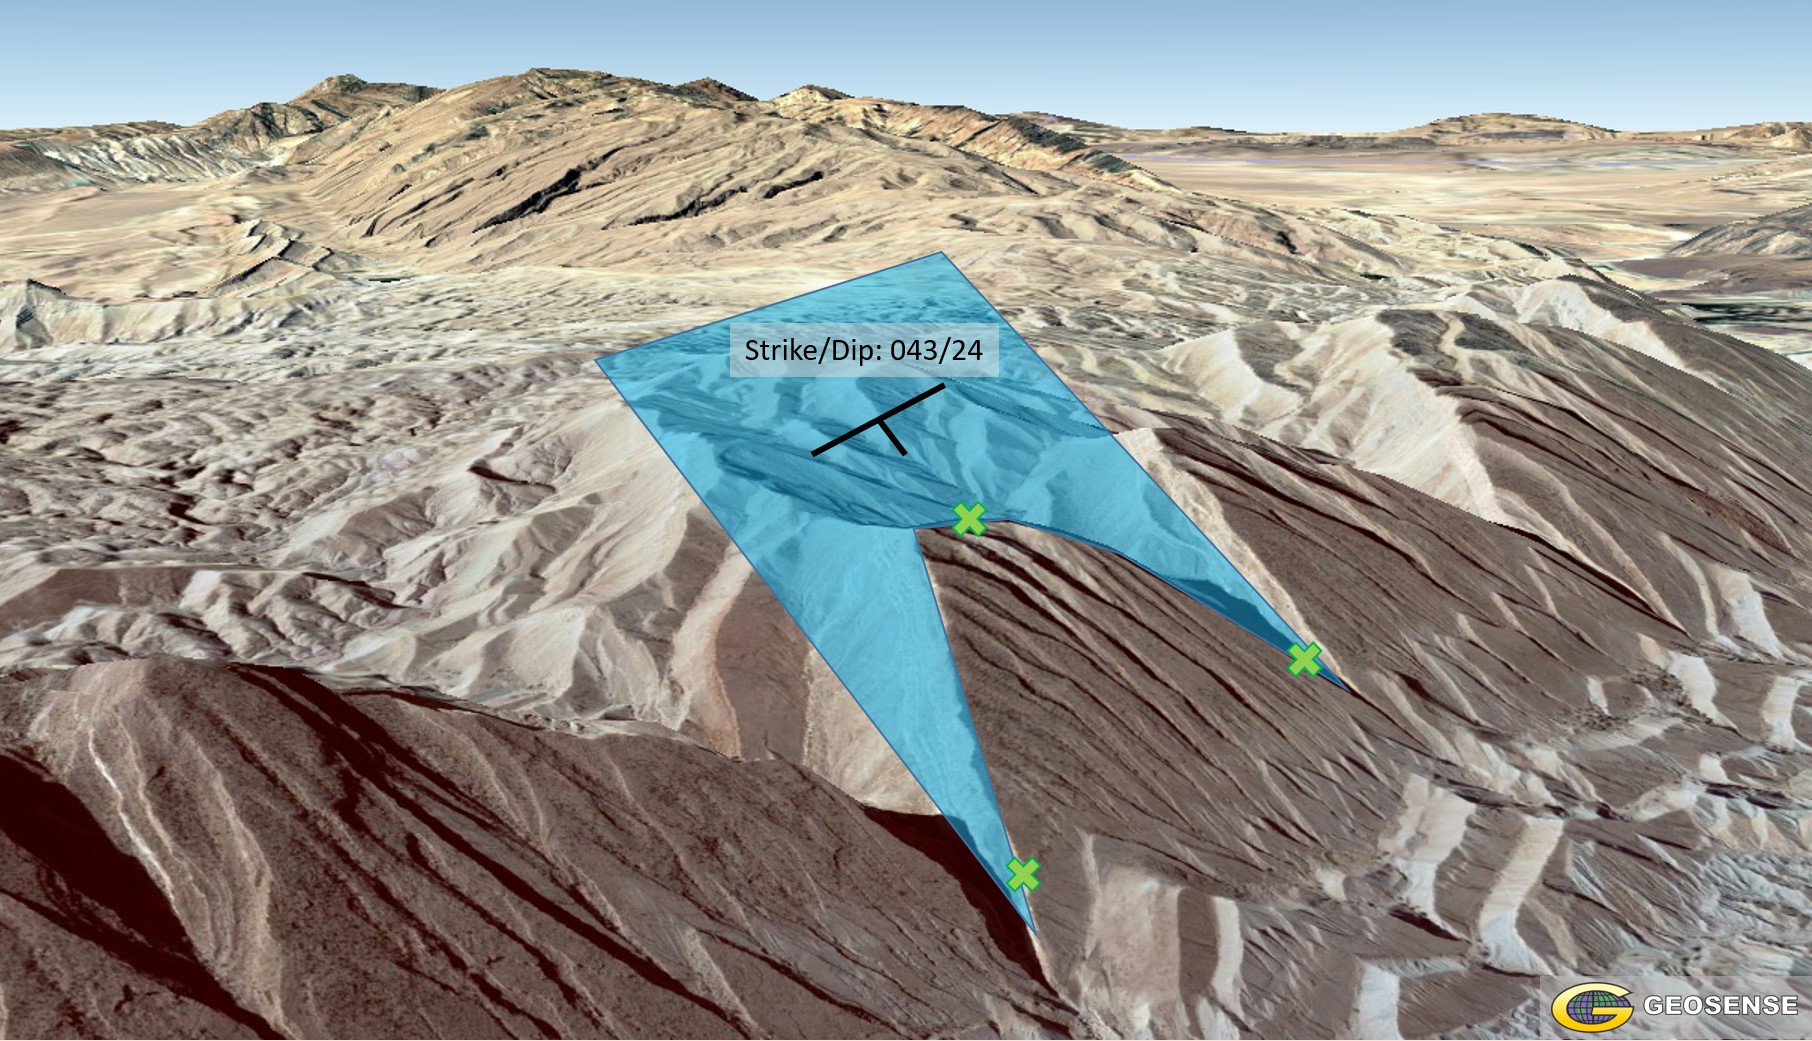
Figure 1: Flatirons in the Zagros Mountains. The orientation of the strike and dip of the bedding is measured using three points that are part of the same layer. (source of image: Google Earth)
An explanation of what is measured and calculated when using this method: GIS software shows geographic location as X and Y coordinates (figure 2), the DEM adds the third, vertical dimension, turning each geographical point into a point in 3D space (X, Y, Z – figure 3). The geologist picks three points that are all part of the same stratigraphic layer (at its intersection with the surface) and the software calculates the orientation of the plane in 3D space by resolving the ‘three point problem’ (figures 1, 3 & 4). Just like in the field, the accuracy of the end result depends on the ability of the geologist to recognize the surface expression of stratigraphic layering. The difference is the top down perspective and overview of a large region, rather than the outcrop scale in the field. Therefore, the ability to recognize these often very subtle surface features requires a solid experience in the geological interpretation of remote sensing data.
While elevation data provides the information needed for the calculation of bedding dip directions, it should be combined with imagery to aid the recognition of individual layers. Some layers are obvious enough in the elevation data, while others are more apparent in the imagery, due to the changes in spectral signature between different lithologies. For this method to provide accurate results, it is important to recognize faults that displace layers, as fault offset between the three points used for the measurement would distort the outcome. Just like with stratigraphic units, some faults are more apparent in elevation data, while others are more visible in imagery.
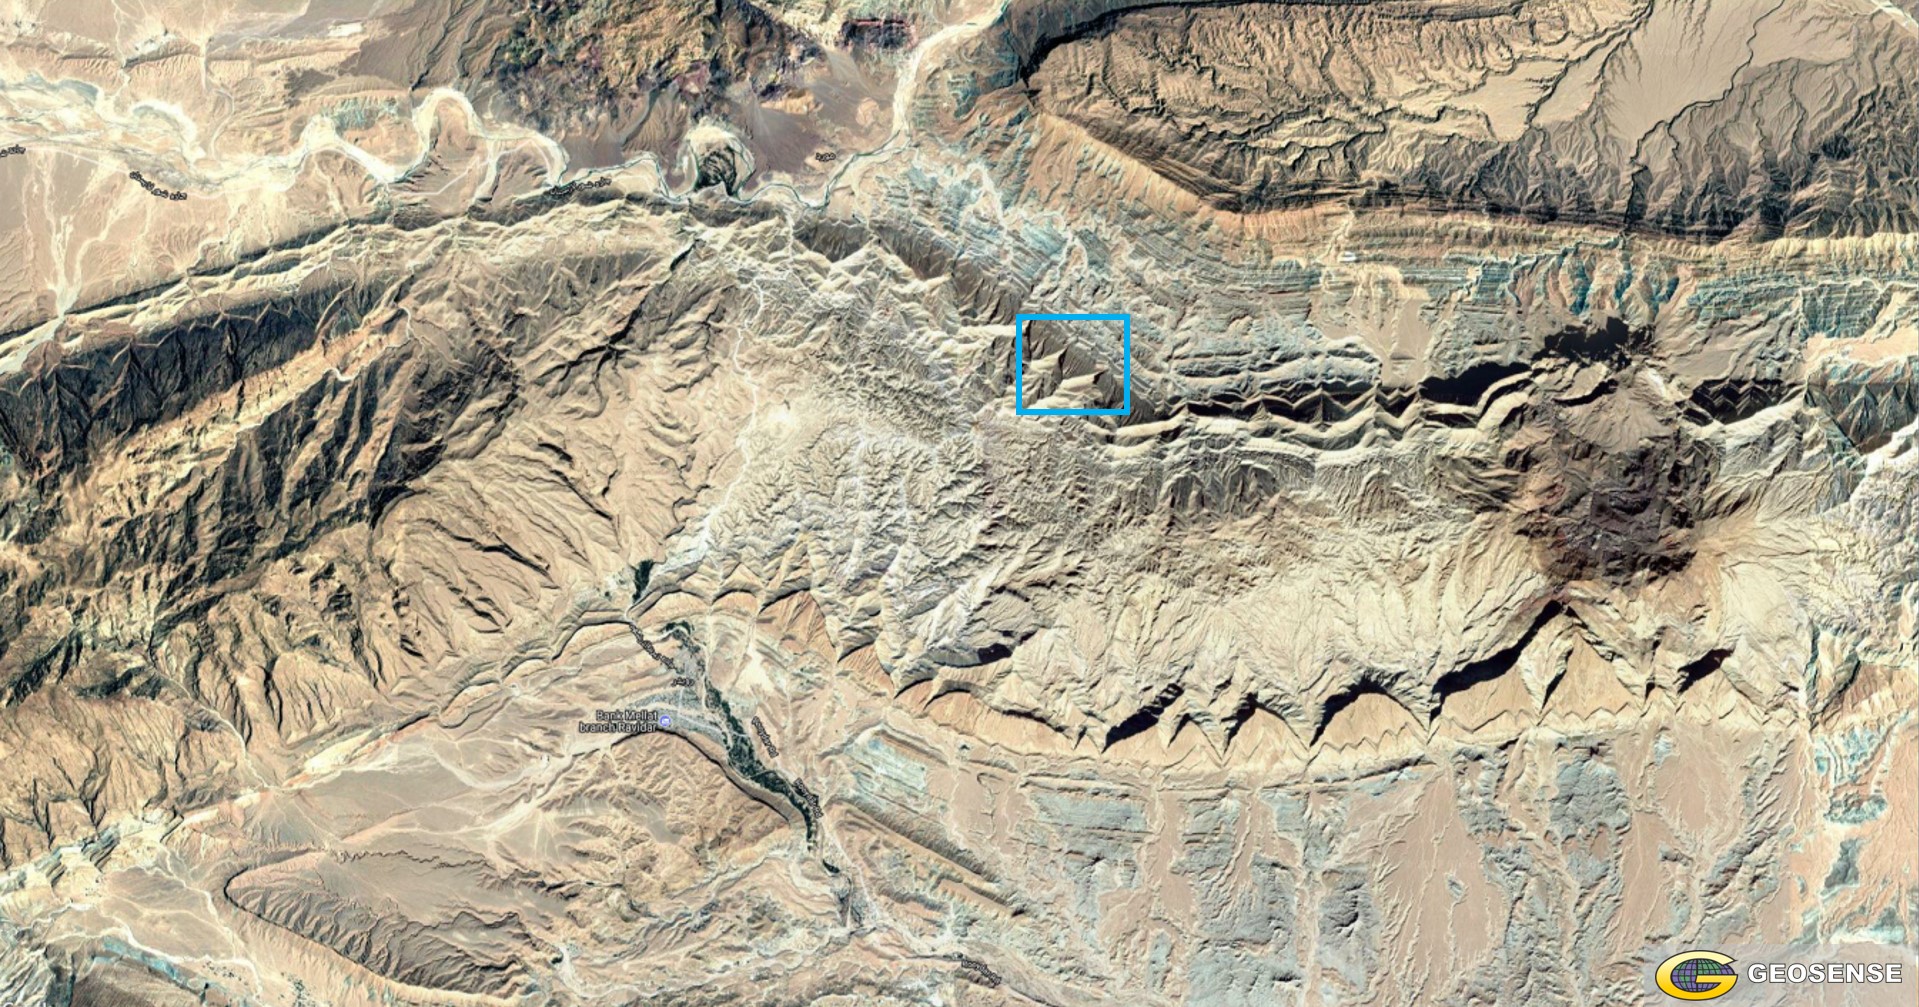
Figure 2: Part of the Zagros Mountains, with textbook examples of flatirons, as seen from above. The location of figure 1 is marked by a blue box. (Image source: Google Earth)
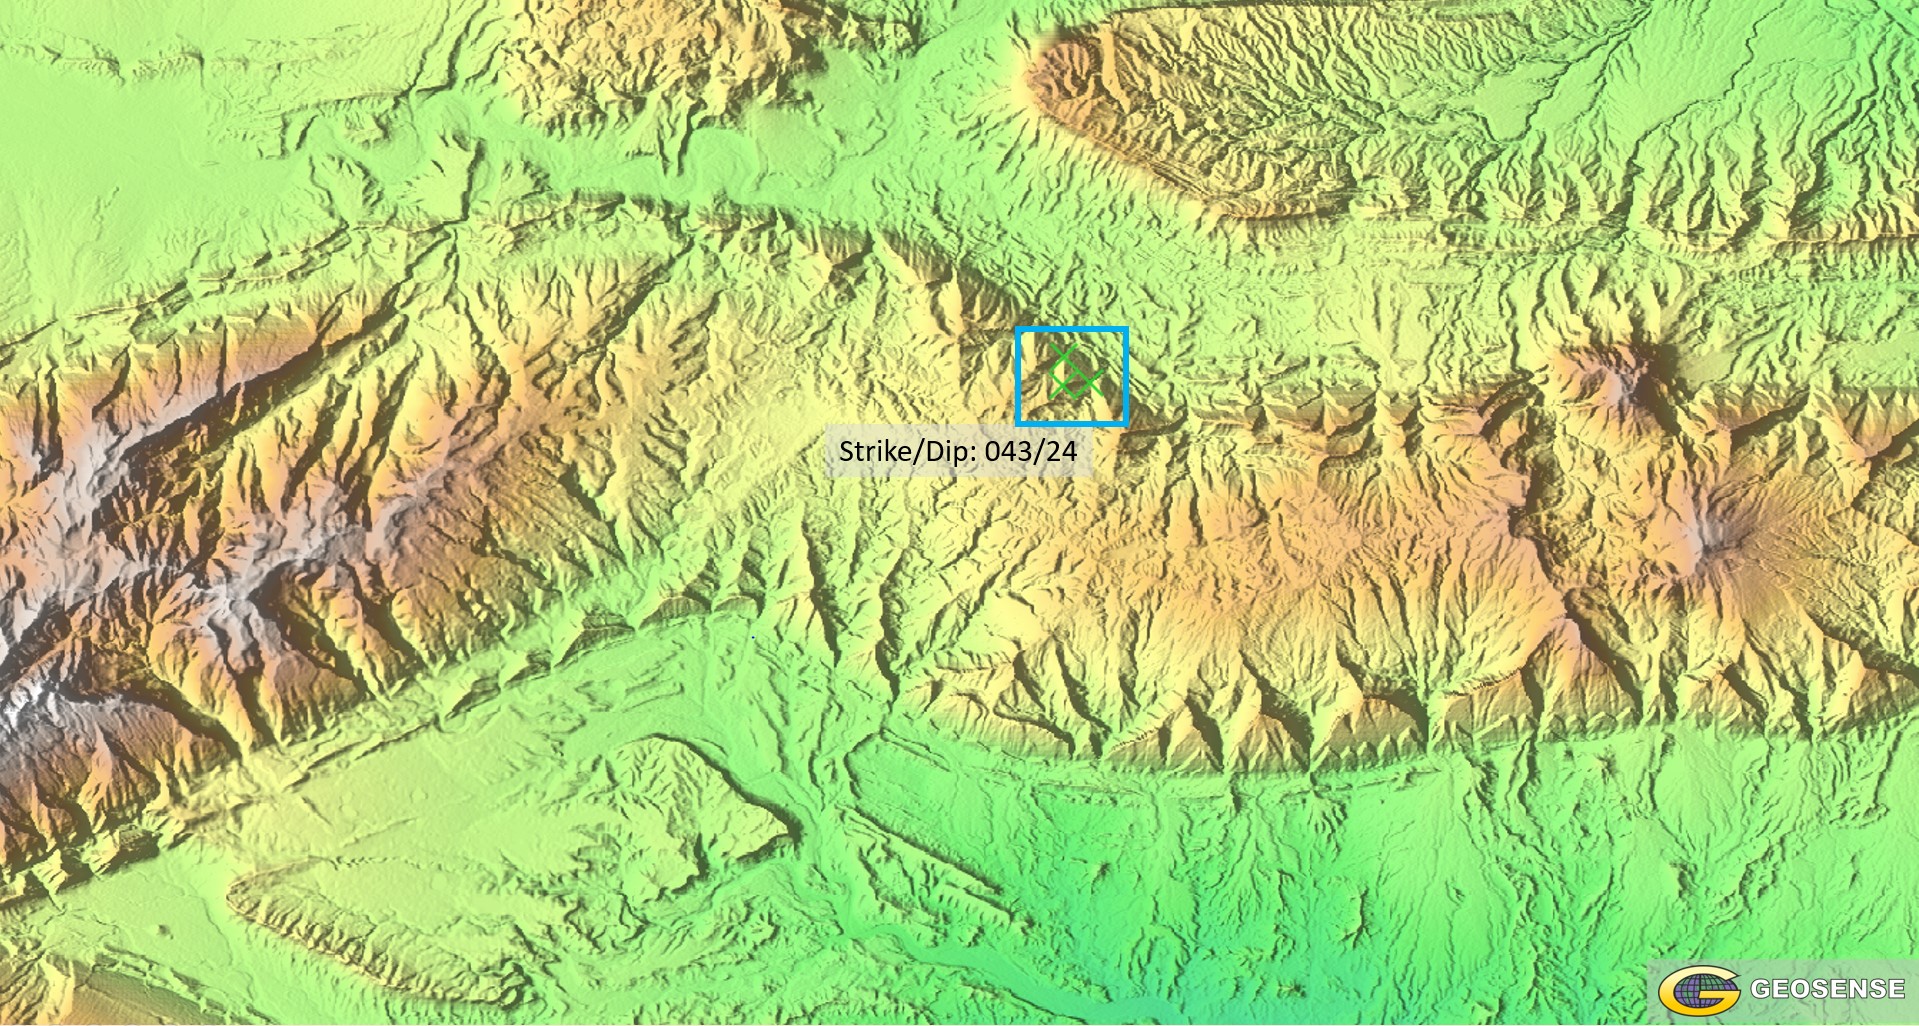
Figure 3: DEM of the same area as figure 2. The blue box shows the location of the three points (green crosses) that were used to measure the dip of the layer in the location of the flatiron in figure 1. (Elevation data: AW3D30 DEM)
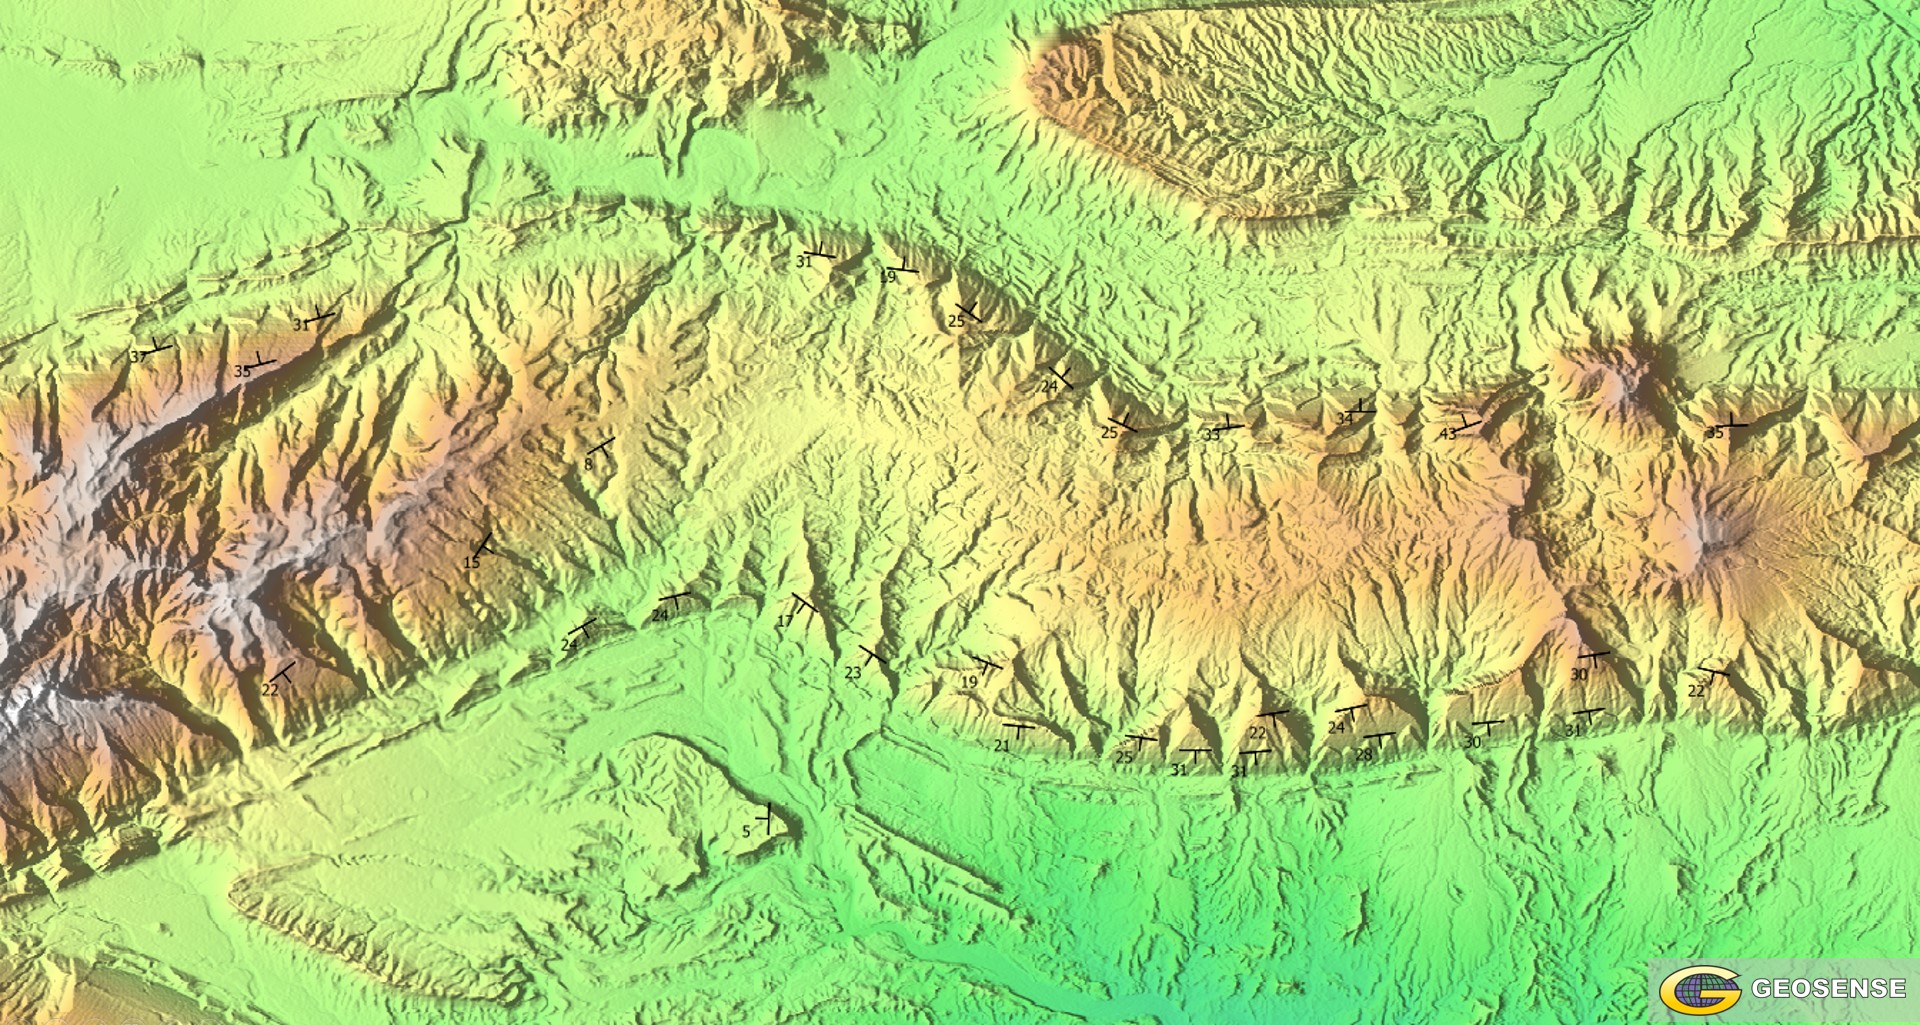
Figure 4: Numerous bedding dip orientations, all measured remotely and quickly, over a large area (approximately 40 km E-W, by 20 km N-S). (Elevation data: AW3D30 DEM)
Available datasets
For the example from the Zagros Mountains (figures 3 & 4) a 30 meter resolution DEM was used. Many higher resolution datasets are currently available, some derived from satellite data, others acquired by airplane (e.g. LiDAR) or drone (e.g. photogrammetry). These datasets enable the recognition of more dips, with increasing confidence in the accuracy of the measurements, as the spatial resolution increases. High resolution DEMs make it possible to detect the subtle topographic surface expressions of sedimentary beds, which are just too small to appear on coarse, low resolution elevation data. Under the right circumstances, the highest resolution elevation datasets even allow for the measurement of the orientations of planar features other than bedding strike and dip, such as fault planes, veins and dykes. The increasing availability of very high resolution remote sensing data only expands the possibilities for their use in detailed geologic mapping, particularly at scales at which most regions haven’t been mapped before.
Summary
Modern digital elevation datasets allow for the measurement of the orientation of bedding strike and dip (and under the right circumstances other planar features) in 3D space, through the resolution of the three point problem in GIS software. This allows for the quick and accurate measurement of many dips over a large region. This remote method is particularly useful in regions were access is difficult or limited, and provides quality information during the preparation of fieldwork and in areas where structural data is scarce. High resolution DEMs enable an increase in the number and accuracy of dip measurements. A geologist controls the algorithm, therefore the quality of the measured dips is related to the ability of the geologist to recognize the surface expression of stratigraphic bedding (and other planar features) in remote sensing datasets.
The method described in this article is part of the core expertise of Geosense, and is part of any geological mapping projects in areas where accurate knowledge of the bedding dip direction benefits the geological understanding of the mapped region.
This article has also been published on LinkedIn.